- The Competitiveness Framework video
- Foreword
- Executive summary
- UK competitiveness at a glance
- UK competitiveness at a glance – Investment drivers
- Introduction
- What is the Competitiveness Framework?
- How are investment decisions made?
- What steps are being taken to improve the UK’s investor offer?
- Chapter 1
- Chapter 2
- Chapter 3
- Competitiveness Framework
- Appendix
- References
The Competitiveness Framework - 2 minute overview
Foreword
In a changing, and fiercely competitive international landscape, ensuring that there is a shared understanding between industry and government about the factors which influence investment has never been more critical.
The government's ambition is to make the UK the number one life sciences hub in Europe by 2030, while also transforming health outcomes and building an NHS fit for the future. Achieving that goal is only possible if the UK doubles down on its strengths, urgently addresses systemic weaknesses, and capitalises on areas of unrealised potential.
This framework serves as a vital tool to identify, shape and prioritise the policy interventions
needed to make the UK one of the world’s leading economies for pharmaceutical industry investment.
Dr Richard Torbett MBE
Chief Executive
Association of the British Pharmaceutical Industry
Executive summary
▸The UK is home to one of the world’s leading life sciences ecosystems. The government has set out a clear ambition to put life sciences at the heart of its health and growth missions
▸ However, faced with unprecedented international competition to attract and retain this globally mobile investment, the UK’s world-leading status is at risk.
▸ The pharmaceutical industry is integral to both missions, contributing £17.6 billion in direct gross value added (GVA) annually to the economy,1 supporting 126,000 high-skilled jobs across the UK,2 and investing more in R&D than any other sector.3
▸ Life sciences foreign direct investment into the UK fell by 58% from £1,897 million in 2021 to £795 million in 2023.4 Pharmaceutical industry investment in R&D also fell by nearly £100 million in 2023,3 and the UK has lagged global growth trends for several years.
▸ To realise the UK’s life sciences growth potential, it is vital that government and industry share an aligned view about the factors driving investment decisions.
▸ The costs of falling behind in the global race for investment are significant. Had industry investment in pharmaceutical R&D in the UK grown in line with global investment from the world’s top 50 pharmaceutical companies, the UK would have received £1.3 billion of extra R&D investment in 2023 alone.5
▸This “Competitiveness Framework” supports that shared ambition by benchmarking the UK’s performance against competitor markets to identify where action is most needed to attract pharmaceutical industry investment.
▸ Reversing these trends is therefore vital to the government and industry’s shared growth and health agenda.


- These declines are not due to a lack of foundational strengths. The UK’s science base continues to offer world-class scientific expertise and globally respected academic institutions. Robust intellectual property (IP) protections and substantial public investment in research infrastructure augment these strengths, encouraging industry co-location.
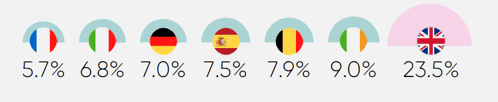
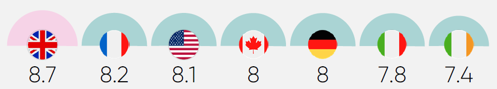
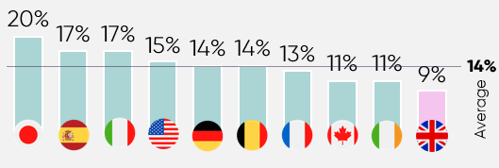
- However, these strengths are undermined by the UK’s long-standing underinvestment in medicines, threatening the growth and retention of industry investment. The UK invests less in medicines than other developed market (9% of healthcare spend in the UK, versus 14% in Germany and 17% in Spain).6
Globally, the UK ranks:
 Top universities16
 Research quality18
- New medicines launched in the UK are regularly made available to highly restricted patient populations, compared to launches in similar markets.7 New medicines also have lower levels of uptake in the UK than in other countries,8 with regional variations in UK uptake contributing to health inequalities.9
- The UK also boasts one of the world most vibrant environments for biotechs and spinouts, 3rd only behind the US and China,20 as well as a highly skilled talent base. These factors provide an attractive platform from which the UK can attract significant inward investment, provided it can maintain this advantage amid growing competition.
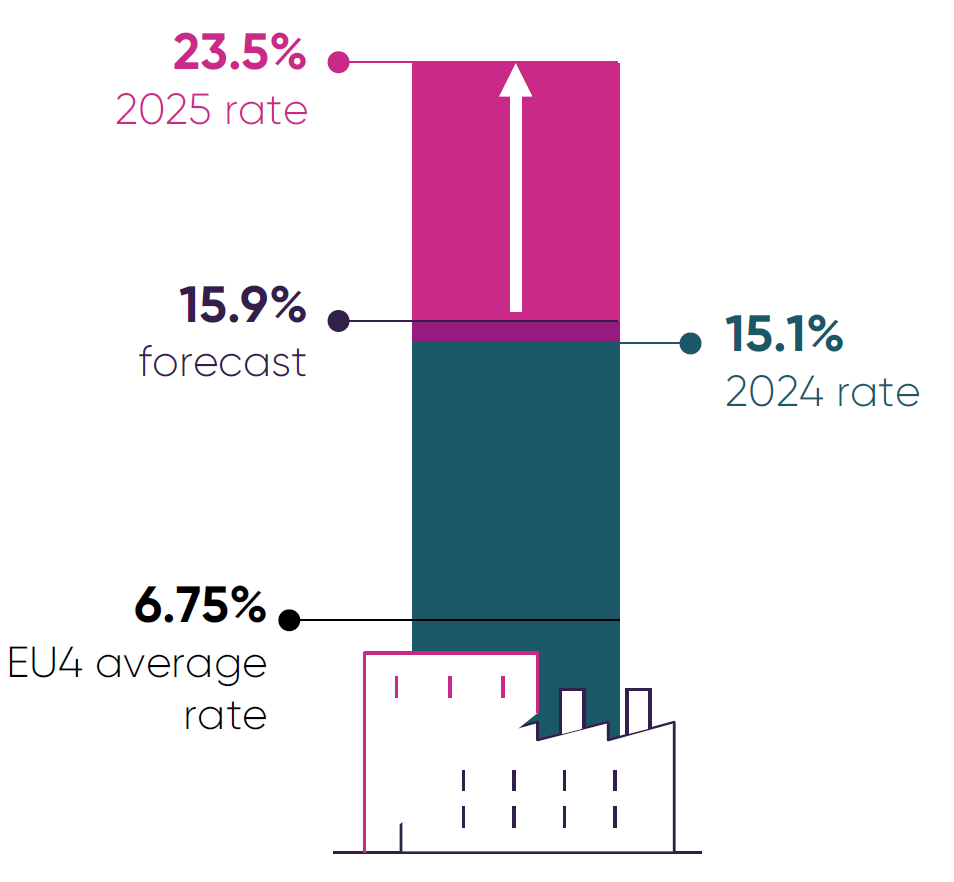
- High clawback rates on pharmaceutical companies’ UK revenues exacerbate these persistent structural barriers to investment. The announcement that the 2025 clawback rate for newer medicines would rise to a minimum of 23.5% (above the predicted 15.9%) lowered investor confidence in the UK.38
- While high clawback rates have acted as a drag on investment in the UK for several years,37 the unpredictability and scale of the 2025 rate increase has escalated this issue to a critical point. In many global boardrooms, the UK is now viewed as a contagion risk with practices that, if adopted by other markets, would threaten the sector’s ability to invest and innovate globally. As a result, the UK is increasingly being ruled out of consideration as a viable location for pharmaceutical investment.
- Constraints in clinical trial delivery, historically a UK strength, have further eroded investor confidence. While there are signs of recovery in industry trial activity,11 the UK still lags competitors such as Spain in influential performance indicators, such as speed of set-up and participant recruitment.
- The Prime Minister’s commitment to reduce trial set-up times to an average of 150 days is a welcome recognition that the UK’s performance must improve to rebuild investor confidence, though this will not be sufficient on its own.
- Addressing these structural barriers to investment must be the top priority. To augment these efforts, the UK can enhance its attractiveness to global investors by capitalising on areas of unrealised potential, while building on the UK’s existing strengths.
- Improved utilisation of the UK’s health data could power the discovery and development of new treatments and support more effective deployment of innovation and improved patient outcomes. The recently announced £600 million investment in a UK Health Data Research Service is a positive step towards realising this opportunity.
- The UK has developed a position of global leadership in cell and gene therapy trials – ranking first in Europe.12 The UK government and devolved administrations could achieve significant benefits for patients and the economy if the UK were similarly world-leading in the valuation and timely deployment of effective cell and gene therapies within the NHS.
- The UK can also capitalise on its sovereign regulator status by delivering greater agility and flexibility in its regulatory landscape, while improving the reliability of its core functions. Global partnerships, such as the Access Consortium, provide opportunities to further enhance and differentiate the UK’s investor offer by positioning the country as a launchpad to enter other markets.
- For these opportunities to yield the greatest competitive advantage, decisive action must be taken to address the structural barriers deterring investment. While none of these shifts will happen overnight, reform is possible if government and industry work in partnership to address fundamental blockers and realise opportunities to enhance the UK’s competitiveness.
- With a new Industrial Strategy and Sector Plan we are encouraging the government to adopt this framework as a tool to drive delivery of its ambition to make the UK the top life sciences economy in Europe by 2030.
UK competitiveness at a glance
Business investment in pharmaceutical R&D (£ billion)5
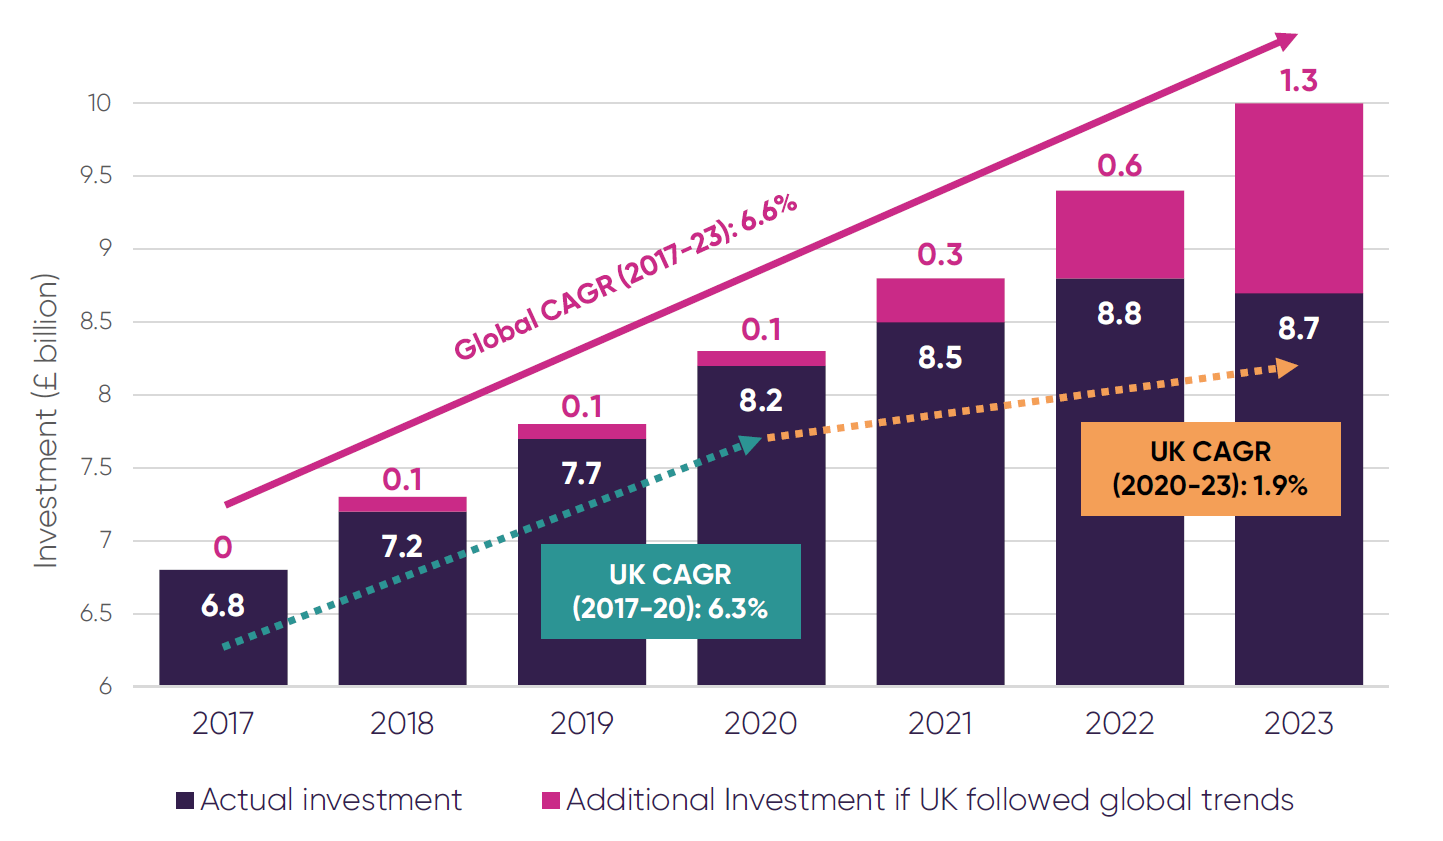
Pharmaceutical R&D investment in the UK has lagged behind global growth trends for several years, with a significant slowdown from 2020. Had the UK kept pace with these global trends, it would have received an additional £1.3 billion of R&D investment in 2023 alone.
CAGR: Compound Annual Growth Rate
Inward life sciences foreign direct investment (£ million)4
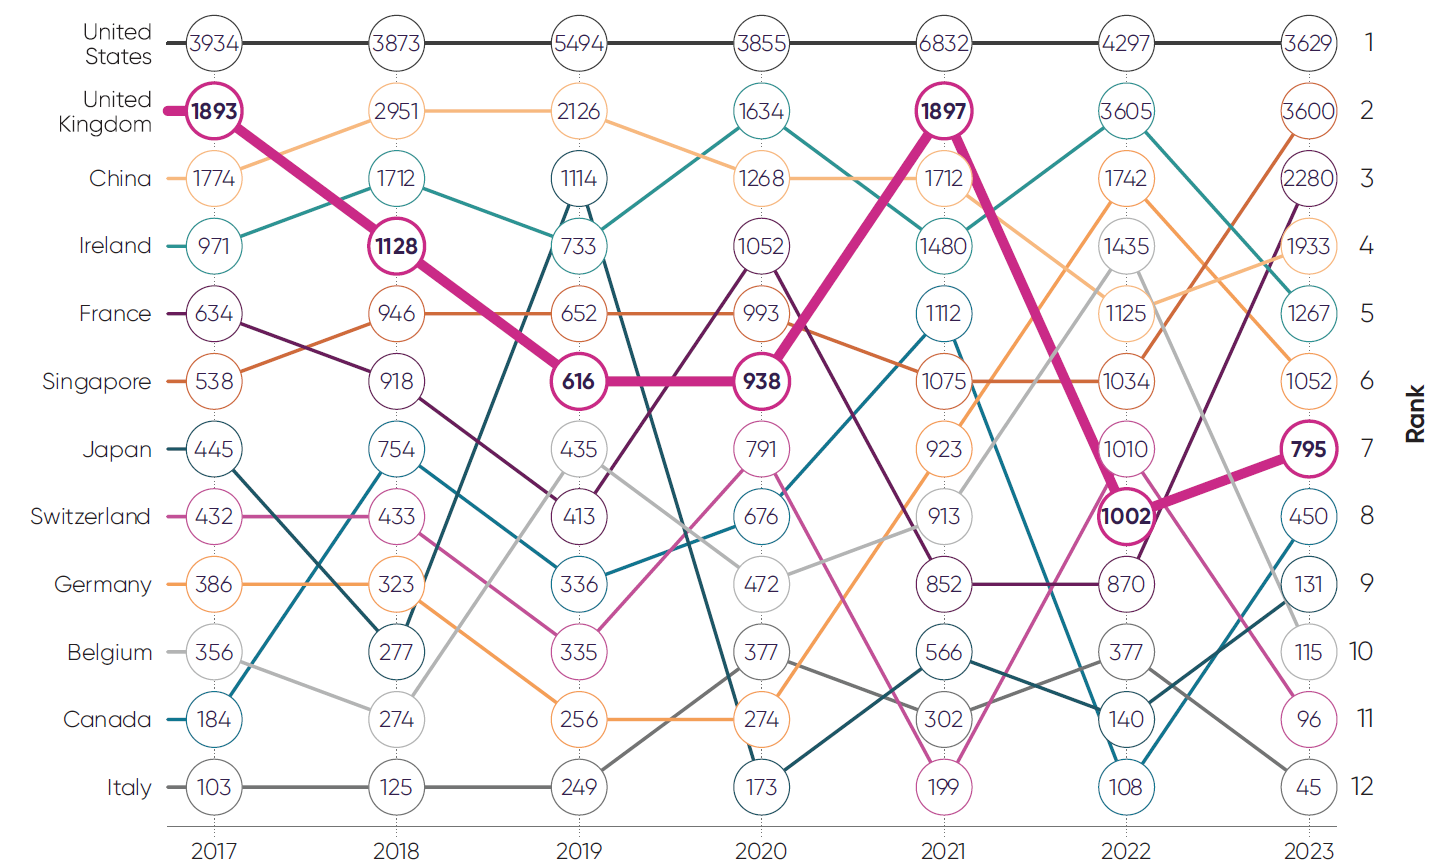
While foreign direct investment (FDI) can fluctuate significantly year to year, the UK’s ranking amongst comparator countries shows a clear trend of decline, falling from a high of 2nd in 2017 and 2021 to 7th in 2023.*
*Data shown is capital expenditure
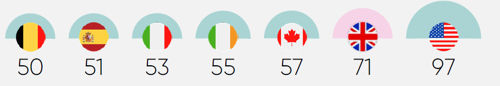
Treatable mortality per 100,000 inhabitants13
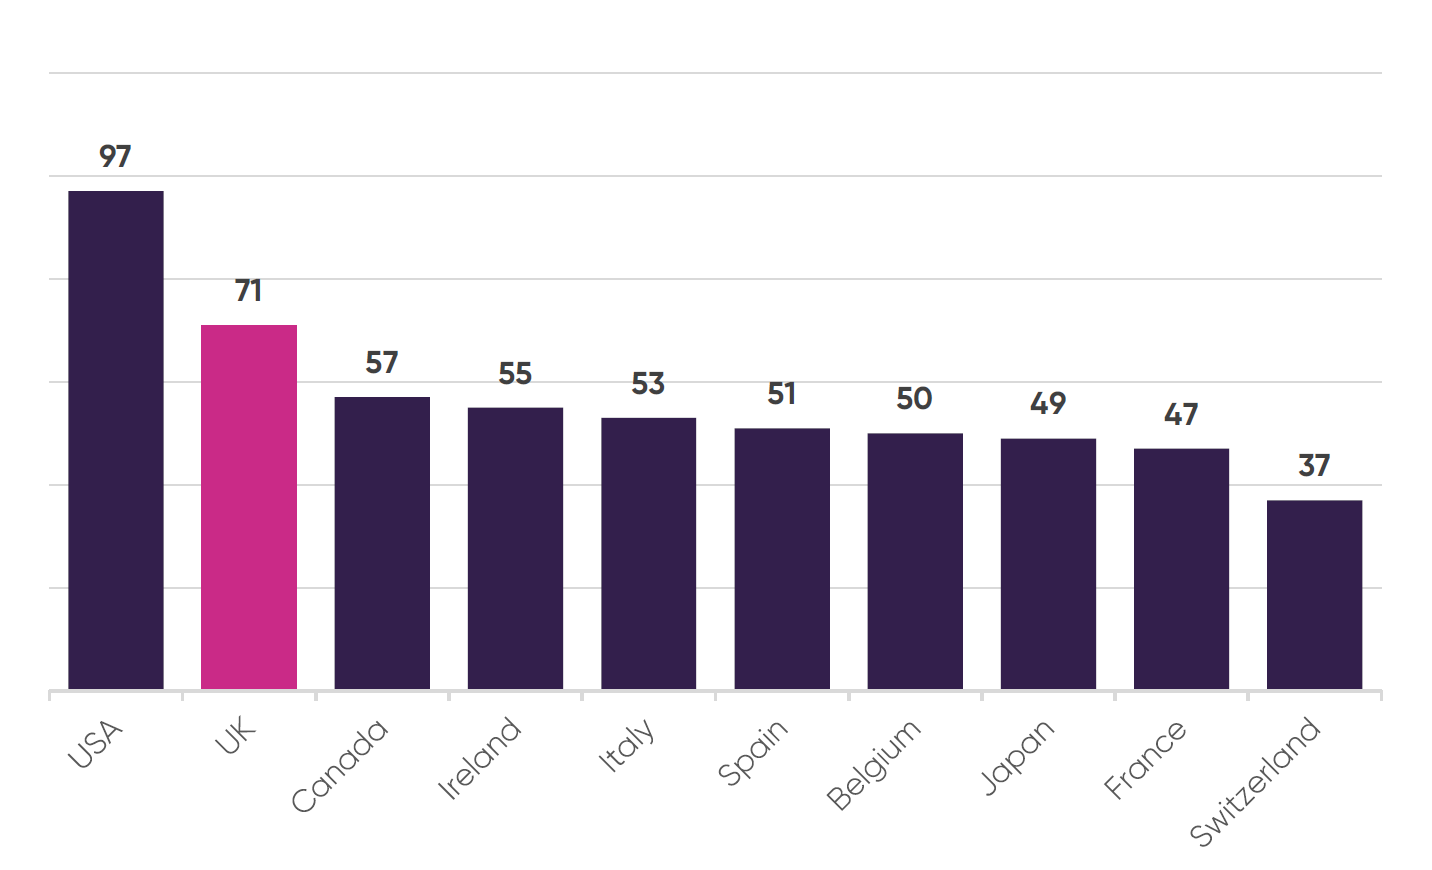
Amongst comparator countries the UK suffers the second highest treatable mortality rates per 100,000 inhabitants, behind only the US. All other G7 and major European economies have significantly lower rates of treatable mortality.
Industry clinical trials initiated per year11
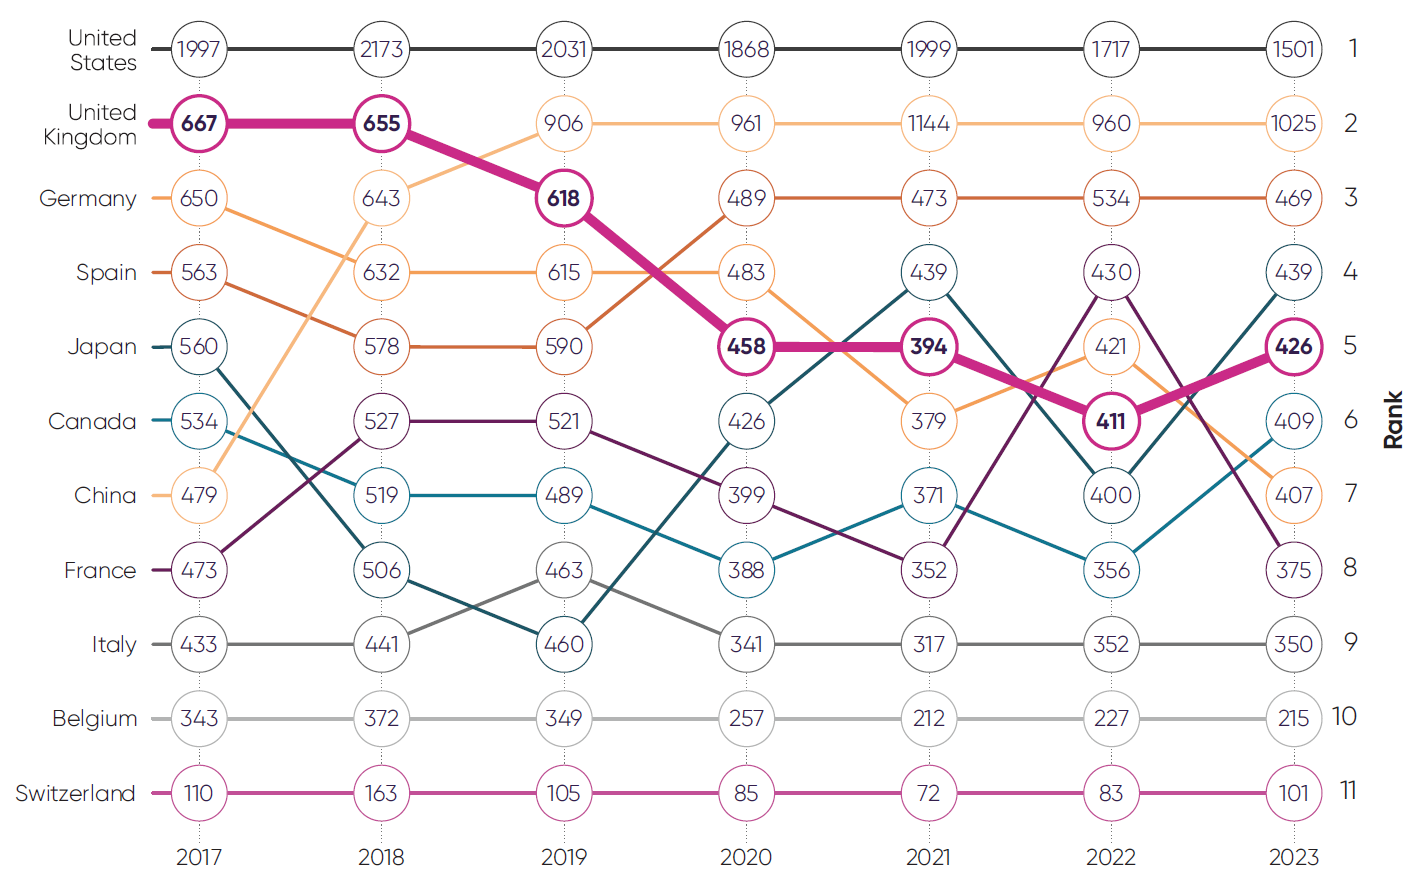
The UK has seen its global rankings for industry clinical trial placement steadily decline since 2018, with early signs of improvement in 2023. Spain in contrast has established itself as the number one European destination for industry clinical trials since 2020.
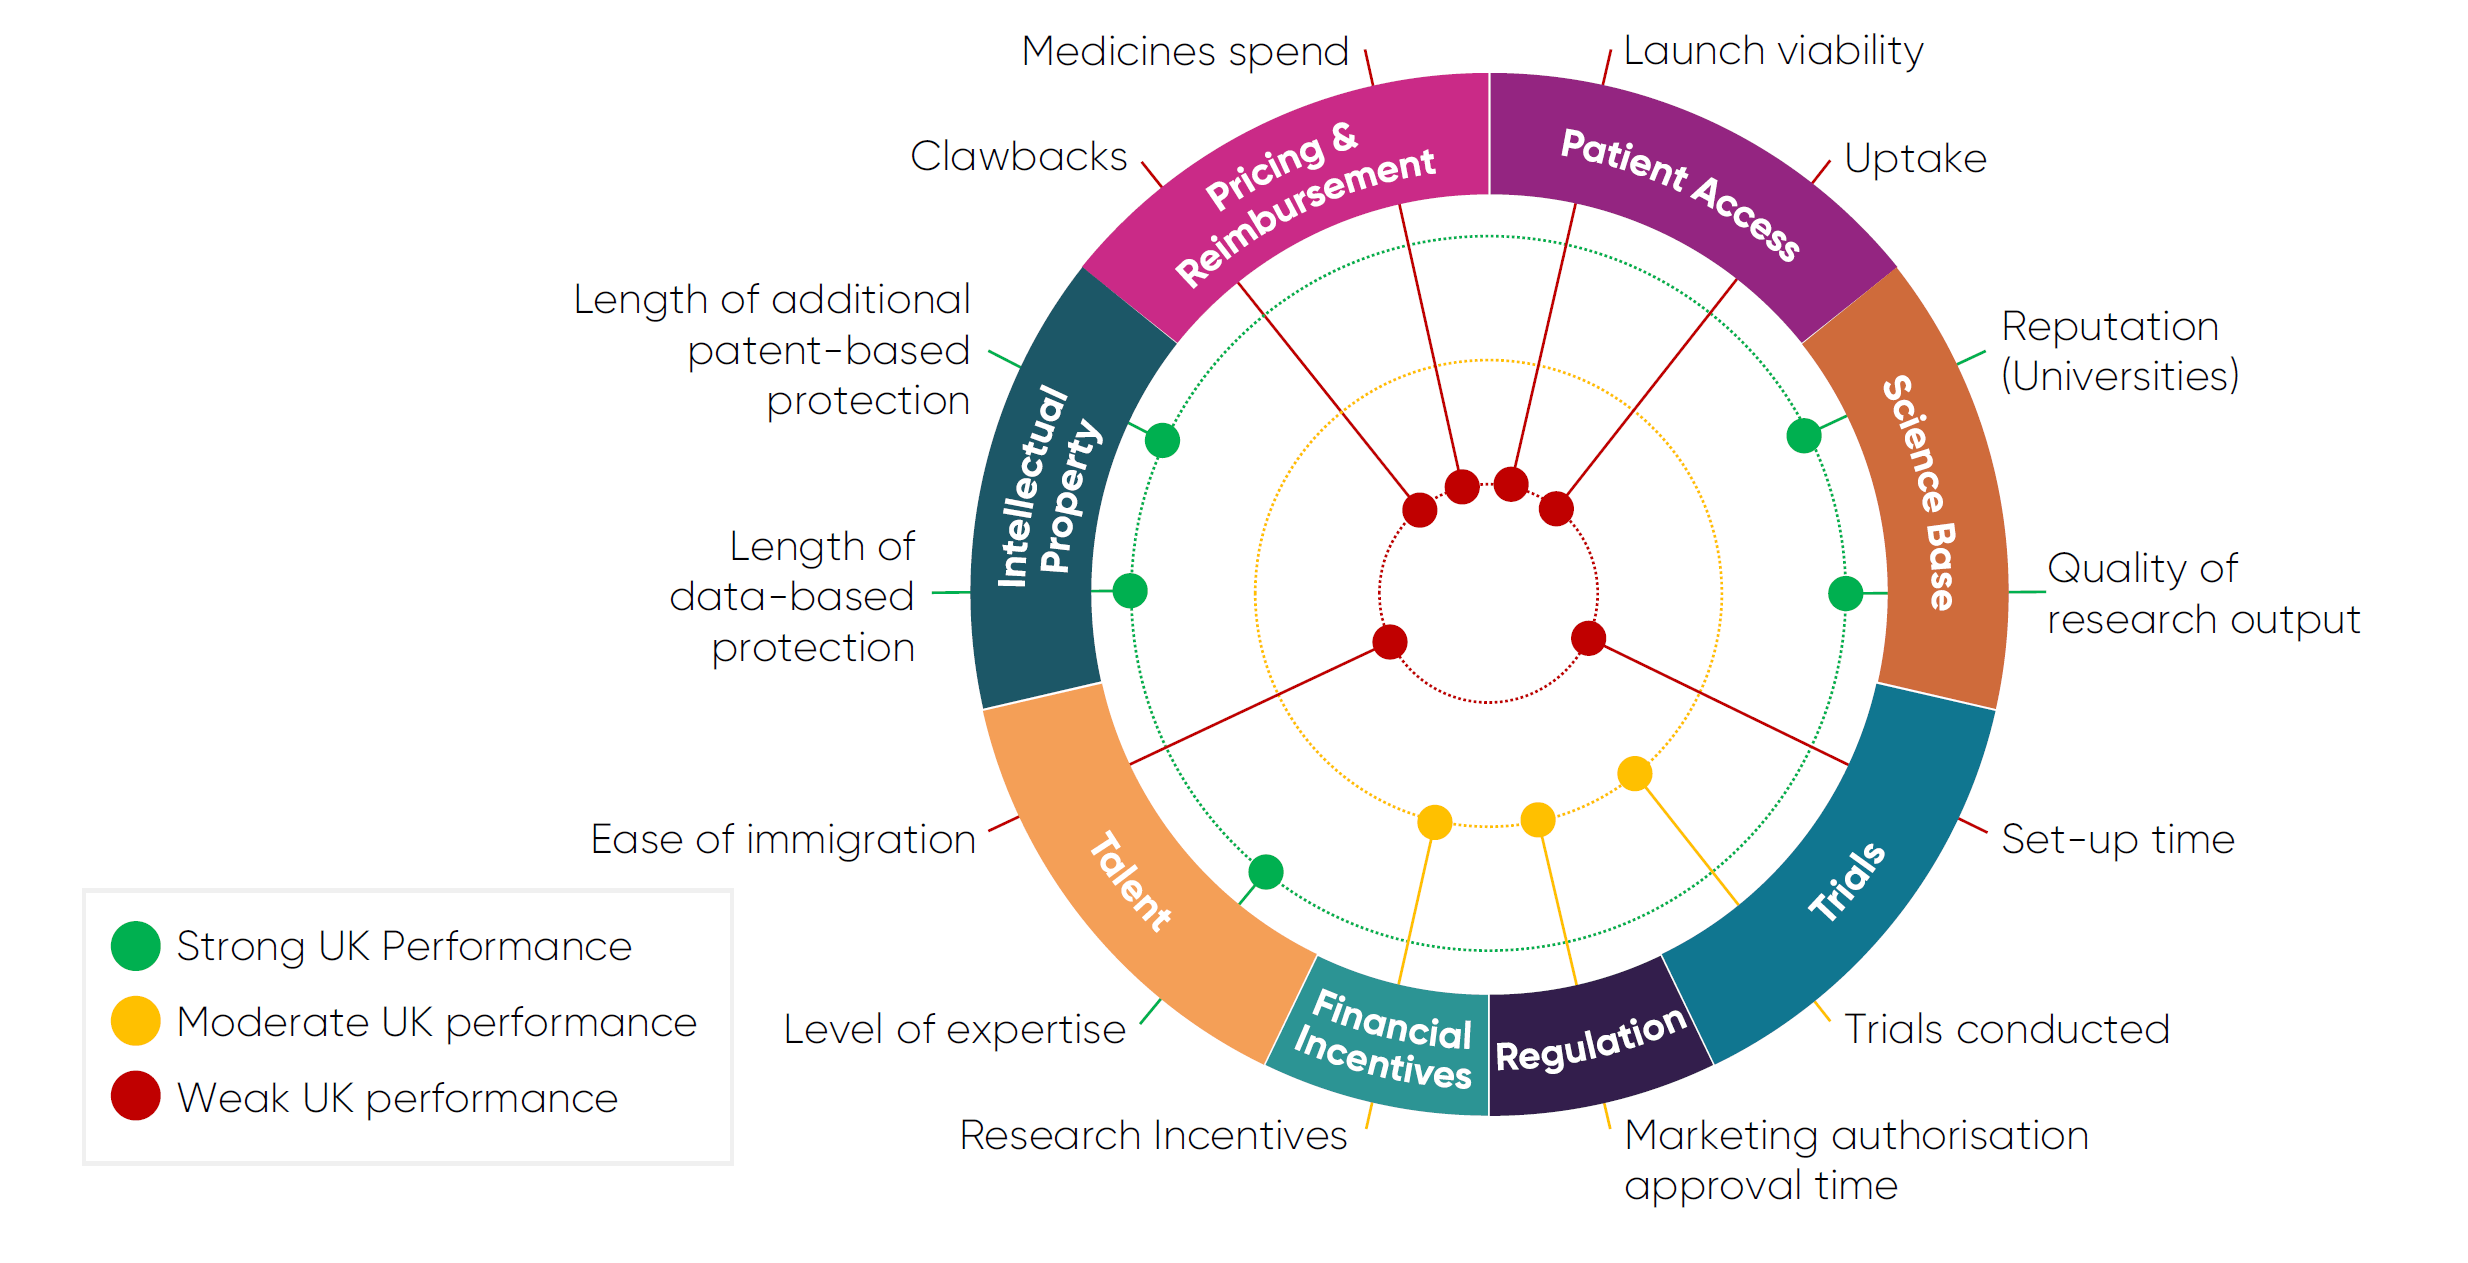
UK competitiveness at a glance – Investment drivers
This chart provides an overview of the UK’s performance on several key indicators that influence the investment decisions of pharmaceutical investors. They are categorised as either a strength, area of moderate performance, or a weakness. Further information on these indicators, including international benchmarking, and raw performance data can be found in the Competitiveness Framework section towards the end of this report.
Introduction
Why have we produced this report?
A competitive pharmaceutical sector is central to the government’s health and growth missions.
Investment fuels the discovery of new medicines and vaccines, enables clinical trials, and powers manufacturing to deliver economic value and health benefits.
With international competition for mobile investment at an all-time high, it is more vital than ever that there is a clear and aligned understanding between government and industry about the factors that influence investment decisions.
While several life sciences strategies have emerged from successive governments with examples of incremental success, the shared scale of ambition between industry and government has never been realised. This unrealised ambition is often due to a lack of alignment or understanding about which factors influence investment decisions and the associated policy interventions that are needed to improve them.
This report compares the UK’s attractiveness as an investment location against 12 comparator countries through a newly created “Competitiveness Framework”. It draws on robust quantitative analysis and insights to highlight where the UK leads, where it lags, and where targeted reform could unlock high-value growth.
This inaugural edition will become an annual publication designed to support and inform the key policy interventions needed to realise the ambitions set out in the government’s Life Sciences Sector Plan.

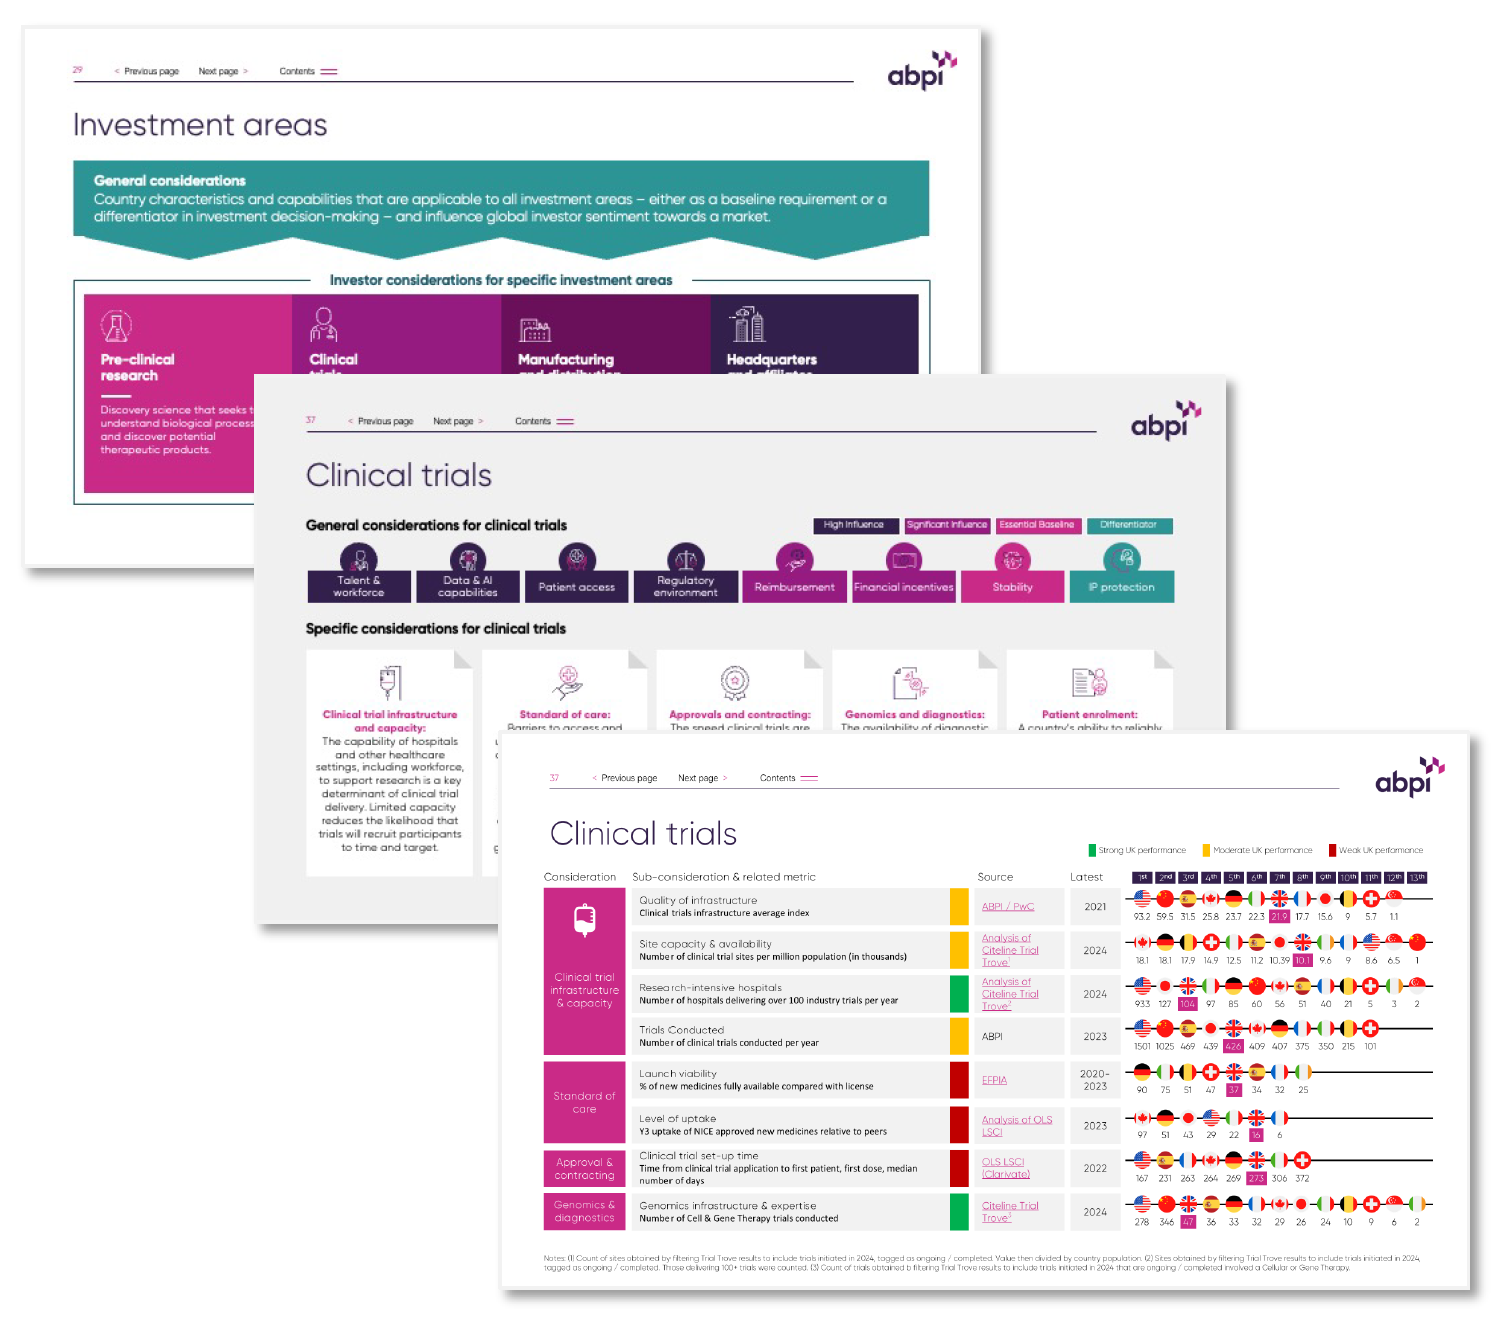
What is the Competitiveness Framework?
The framework provides a structured approach to assess the UK’s attractiveness as a destination for pharmaceutical investment.
It assesses the UK's performance against 12 comparator countries, across the G7, Europe, and Asia, in four areas of pharmaceutical investment: pre-clinical research, clinical trials, manufacturing and distribution, and headquarters and affiliates.
Performance is evaluated by measuring factors that investors consider when deciding where to invest. These investor considerations were identified through a review of public literature and refined in consultation with ABPI member companies.
To ensure this framework is a robust and objective barometer for the UK’s relative performance, the investor considerations are divided into sub-considerations and then matched with relevant, credible, and internationally comparable performance metrics.

How are investment decisions made?
Selecting where to place pharmaceutical industry investment is inherently complex and multifactorial.
Investors weigh up a broad mix of factors, from scientific capabilities and fiscal incentives, to regulatory performance and pricing and reimbursement conditions.
The importance of each factor can vary depending on the nature of the investment and the company’s global operating strategy. With increasing geopolitical instability and its the knock-on implications for supply security, launch viability, and return on investment, some factors have significantly increased in importance.
To assess the UK’s performance, the Competitiveness Framework evaluates a wide selection of metrics aligned to the factors investors consistently cite as critical. Broadly speaking, these investment factors can be categorised in two ways:
- Essential baseline requirements: Prerequisite requirements that a country must meet before a company considers it a candidate destination to invest in. This might include factors like robust intellectual property (IP) protections and access to scientific talent.
- Differentiators: Factors that can tip an investment decision in or out of a country’s favour when multiple countries meet the baseline requirements. Examples include a more favourable incentives regime, or a country’s willingness to adopt innovation.
The way factors are categorised will vary by type of investment, and not all factors will carry the same weight. Occasionally, major underperformance in key areas will have an extreme impact on investor decision making and sentiment. These are identified in this report as global contagion risks – factors that can rule a market out of consideration altogether.
What steps are being taken to improve the UK’s investor offer?
The recently published Life Sciences Sector Plan outlines the government’s ambition for the UK to be the leading life sciences economy in Europe by 2030, and the third most important life sciences economy globally, behind the US and China, by 2035. To progress this ambition, the Sector Plan presents a range of policies intended to improve the UK’s offer to global life sciences investors:15
While the Life Sciences Sector Plan sets a promising direction for advancing the UK’s leadership in life sciences, several areas remain unaddressed.
The reimbursement environment and high clawback rates pose significant barriers and undermine the UK as an attractive destination for life sciences investment.
Addressing these hurdles will be essential to fully realise the plan’s ambitions and unlock sustained industry growth.
Chapter 1
What are the UK’s competitive strengths?
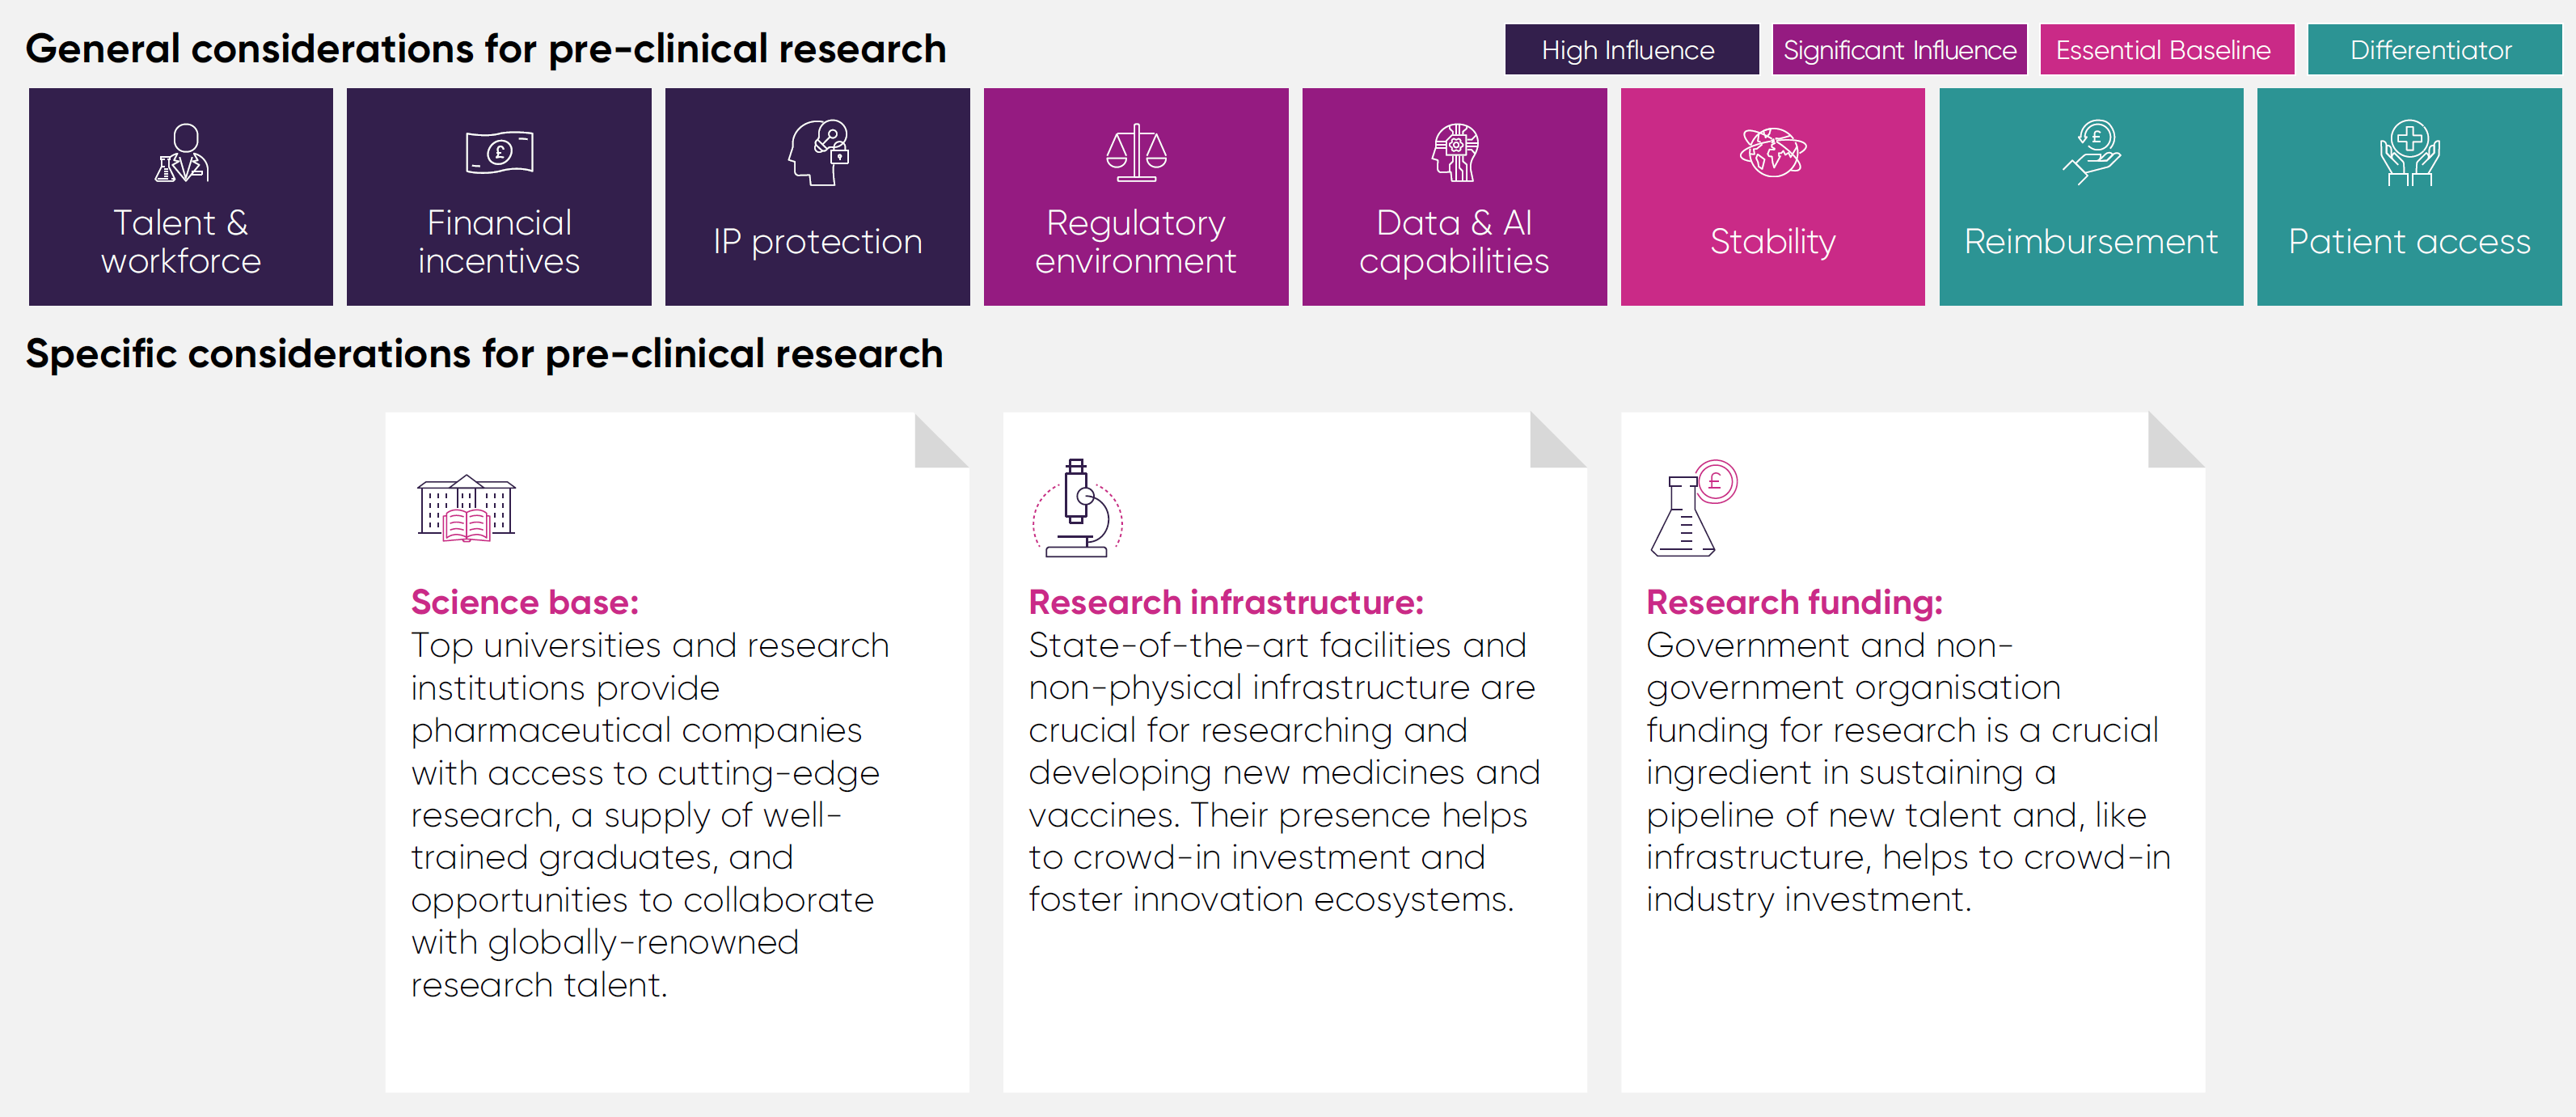
The UK has demonstrated long-standing competitive strengths in pre-clinical research thanks to its globally renowned science base and vibrant biotech ecosystem. Key assets include the UK’s highly skilled talent base, world-class academic institutions, and globally recognised research infrastructure. These strengths are underpinned and made possible through sustained public investment and a well-established framework for intellectual property rights.
Yet despite these well-known and long-standing strengths, inward investment has still declined in the face of rapidly increasing global competition. The UK’s strengths must continue to be nurtured, and it must also be recognised that, despite having historically acted as magnets for inward investment, these strengths are not sufficient to offset competitive weaknesses in other areas.
Competitive strengths
The UK remains a world-leading destination for discovery and translational science. UK expertise in these fields is a major draw for pharmaceutical investment, as companies seek to co-locate their R&D facilities with centres of excellence.
However, the UK’s position cannot be taken for granted. Other countries, notably China, are investing significantly to outcompete scientific hubs like the UK and USA in both the scale and quality of its pre-clinical research offer.
Talent base and research capabilities
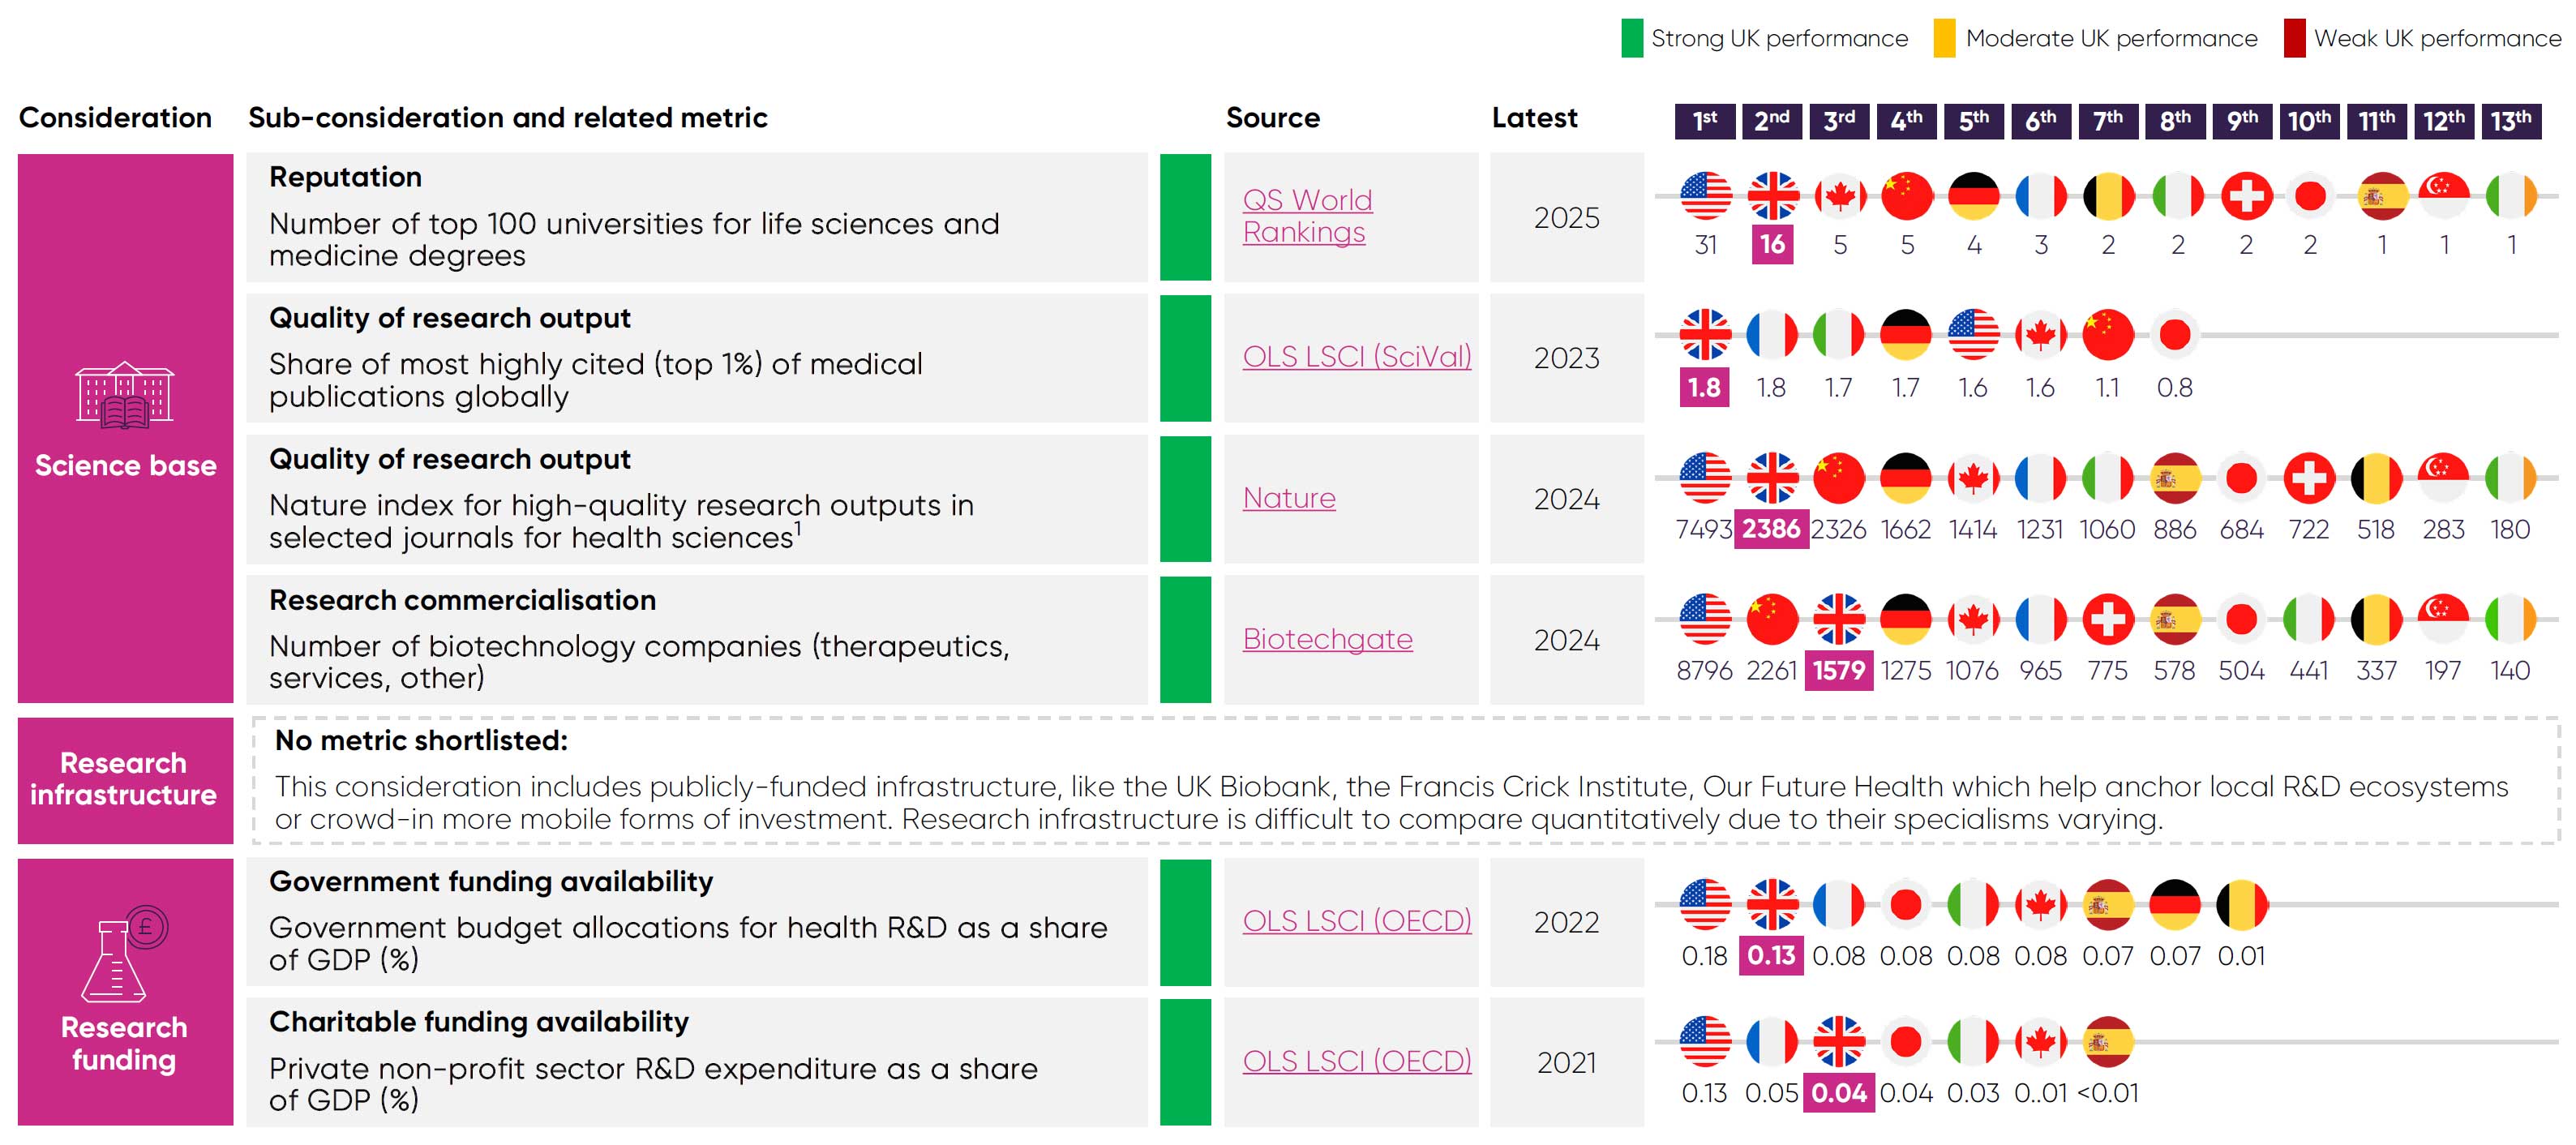
The UK’s competitive edge in pre-clinical research starts with its academic institutions, as it has 16 of the world’s top 100 universities for life sciences and medicine.16
Globally, the UK ranks:
Top universities19 Research quality18These universities provide companies with a rich talent pipeline14 that enables them to meet their skills needs and grow. Their reputation also helps the UK to attract and cultivate leading scientific expertise16 that sustain and grow clusters of innovation. These clusters, in turn, attract industry investment and co-location.
The UK’s academic capabilities are matched by world-class research infrastructure. Notable examples, such as the UK Biobank, the Francis Crick Institute, and the Laboratory of Molecular Biology, afford companies access to specialist talent, equipment, research and analytical capabilities critical to pharmaceutical R&D.
The UK is equally adept in translating these capabilities into research outputs. Nearly 2% of its medical publications ranked among the world’s top 1% most cited,4 the joint highest share among peer countries. The UK also ranks second globally for quality of health sciences research, according to the Nature Index.18
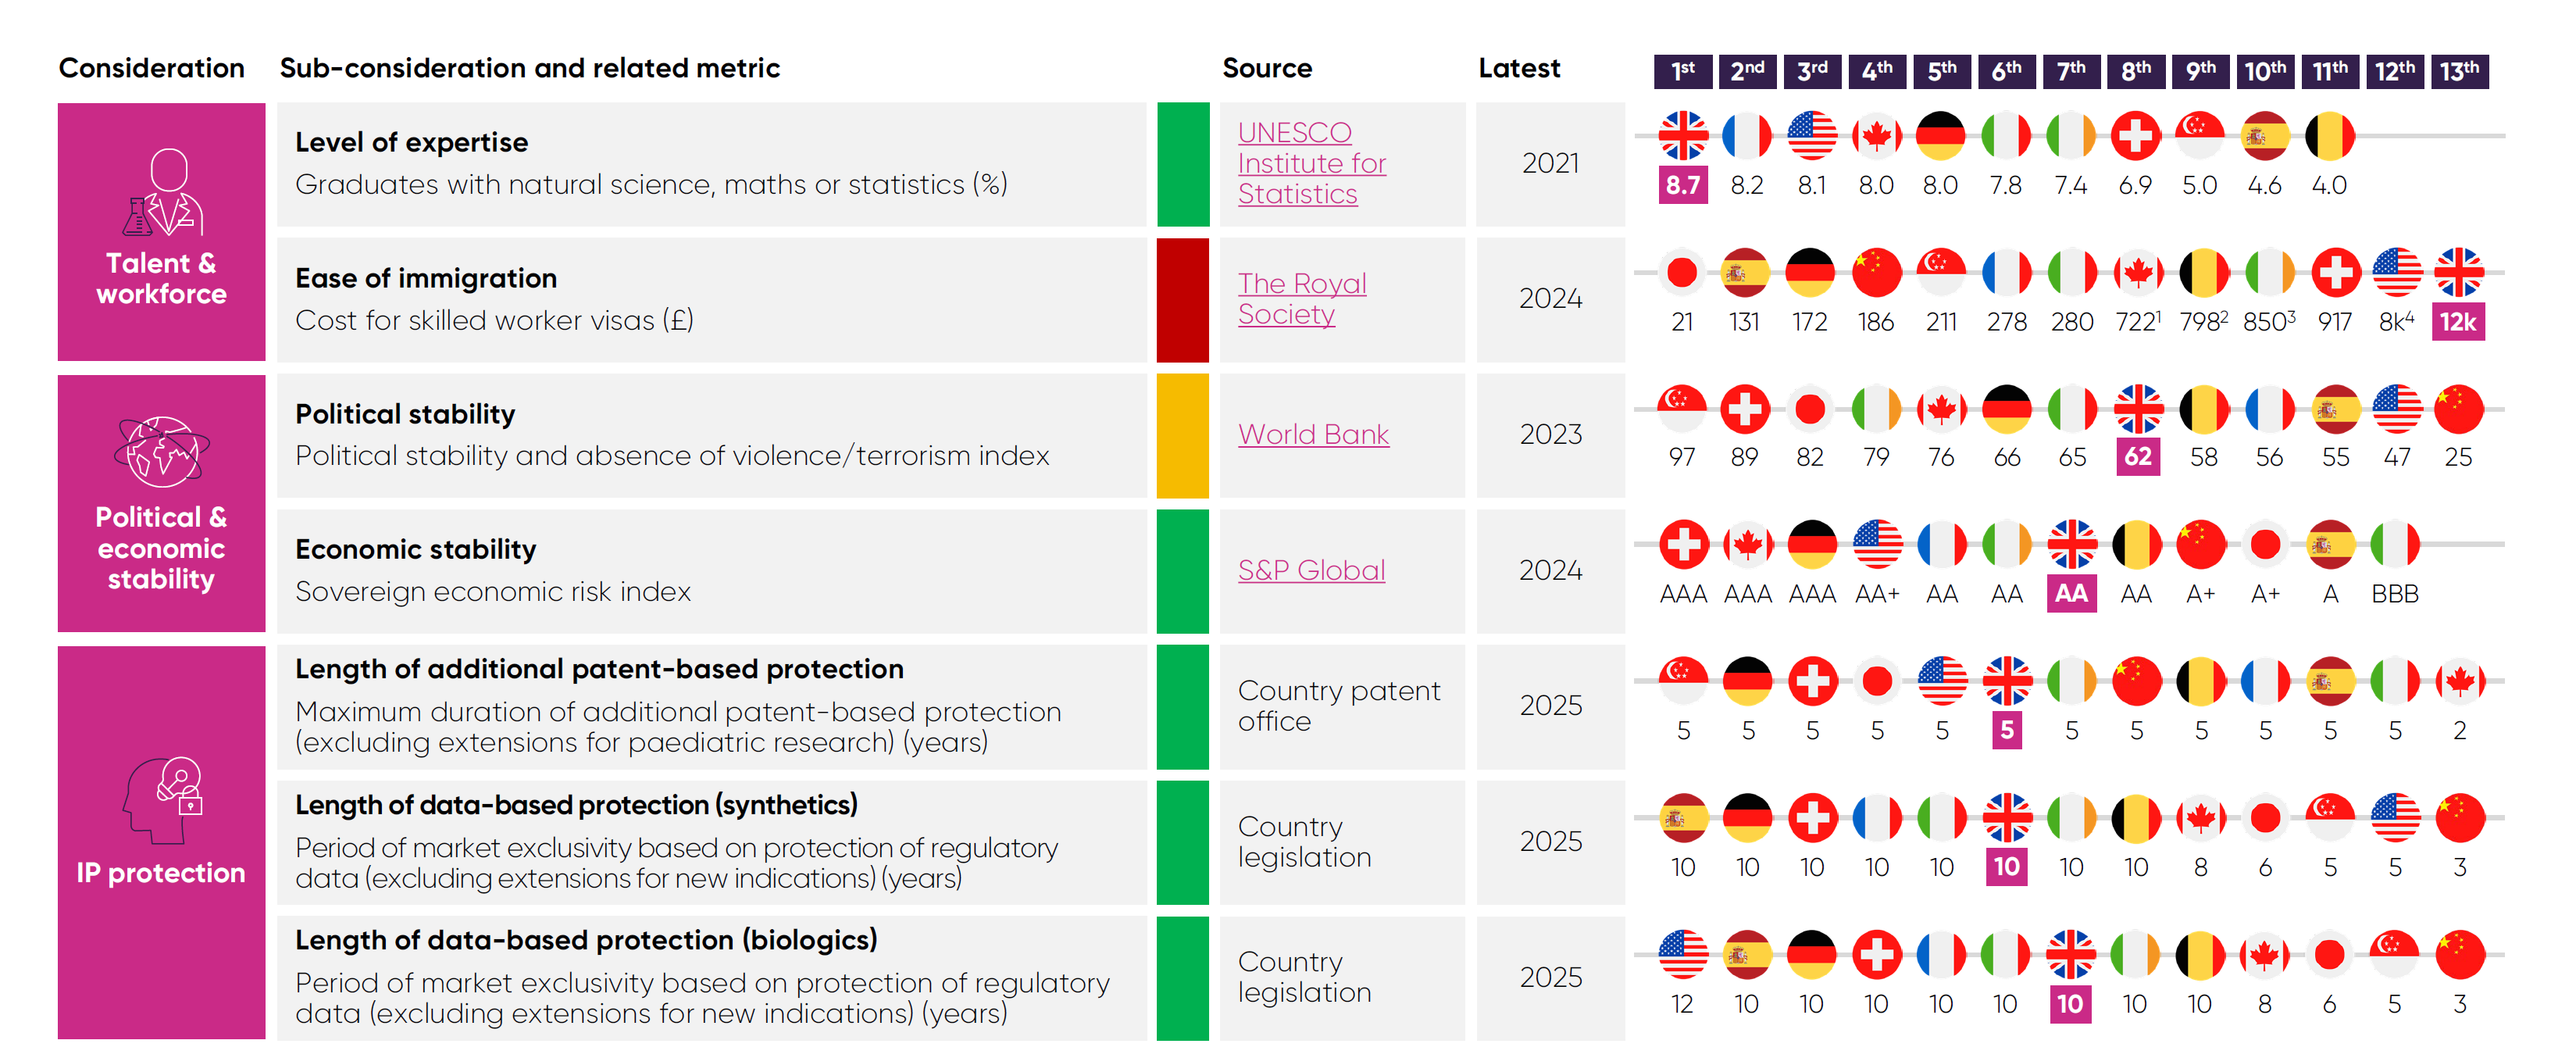
However, the future of these competitive strengths should not be taken for granted. For instance, high visa costs19 make the UK less attractive to the world’s top researchers. The government’s commitment to enhance the Global Talent Visa is a welcome step towards addressing this risk.
The UK also faces growing competition from countries like France, which ranks joint first for most-cited medical publications,4 and China, which ranks third in the Nature Index.18 Many of these countries are home to world-class research infrastructure with capabilities that may soon rival the UK’s assets. As the life sciences sector looks to create up to 70,000 new jobs by 2035,17 the UK must enhance its science base with continued investment to remain competitive in pre-clinical research.
R&D funding environment
The UK’s research capabilities and talent base are underpinned by investments in R&D made by the government and research charities.

Among the comparator countries, the UK ranks second for share of government spending on health R&D4 and joint third for charitable R&D
funding.4 This long-term funding is vital in sustaining the talent pipeline and research infrastructure that attracts global investment in pre-clinical research to the UK.
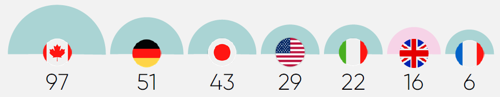
Total number of biotech companies20

This ecosystem demonstrates the UK’s ability to translate academic excellence into commercial potential. For example, in 2024, UK universities produced 399 pharmaceutical spinouts, more
than any other sector.21 Furthermore, between 2017 and 2024, UK-based biotechs raised over $10 billion in venture capital, more than any
other European country.22
Intellectual property protection
Robust protections for intellectual property (IP) also underpin many of the UK’s strengths. A stable and strong IP framework is a baseline
requirement for industry investment.
The UK’s framework for IP rights is seen as one of the world’s most advanced. For example, the durations of the UK’s data- and patent-based protections are comparable with other leading economies.
However, companies can receive a shorter period of patent-based market exclusivity if their product is approved in the European Union before the UK, which does reduce the UK’s strength in this key area.
Biotech ecosystem
A notable and positive consequence of the UK’s strengths in discovery and translational science is its rich ecosystem of biotech companies,
which ranks third globally and first in Europe.20
This cycle of spinouts and early investments augments the transfer of ideas and talent that makes the UK’s innovation clusters so attractive
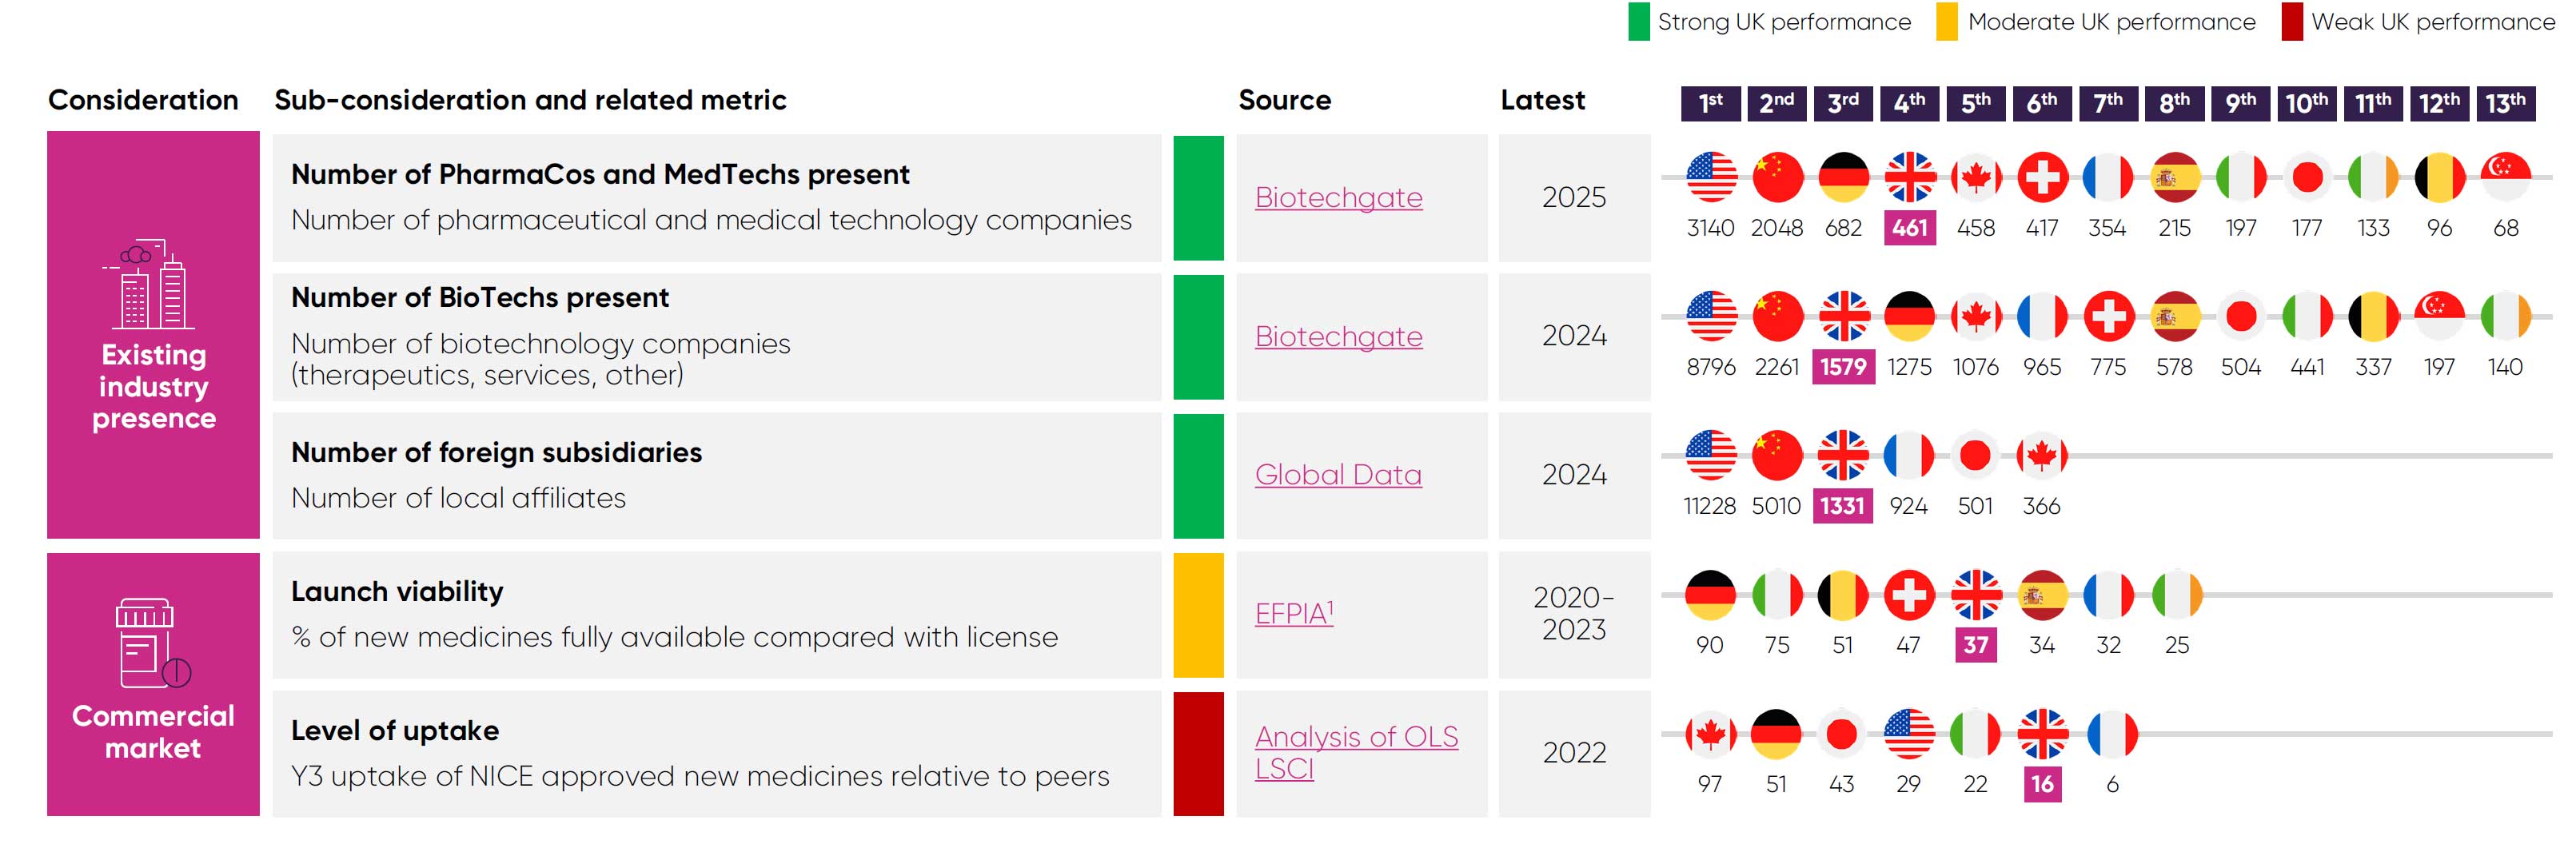
to global investors. The ‘crowding-in’ effect that results from this ecosystem is a major reason why many global pharmaceutical companies to operate headquarters or affiliates in the UK –
ranking second in Europe, behind Germany.20

Competitor countries at a glance

ICH: International Council for Harmonisation of Technical Requirements for Pharmaceuticals for Human Use
Chapter 2
What are the threats to future investment?
Structural barriers continue to deter inward investment into the UK. Of these competitive threats, the UK’s underinvestment in innovative medicines poses the greatest risk to future investment, including its restrictive access arrangements and low uptake. The scale and unpredictability of clawback rates on company revenues in the UK has escalated this issue to a critical point, with many global investors now viewing the UK as a contagion risk, rendering the country unviable as a destination for industry investment.
The government’s recent commitment to improve clinical trial delivery is a welcome recognition that UK performance must improve to rebuild investor confidence. This level of ambition must be applied to addressing the UK’s other competitiveness challenges.
Threats to investment
The Competitiveness Framework shows that the government cannot solely rely on existing strength to make the UK the top life sciences economy in Europe by 2030. Instead, decisive action must be taken to address the structural barriers deterring inward investment, especially its long-standing underinvestment in medicines.
Patient access and uptake
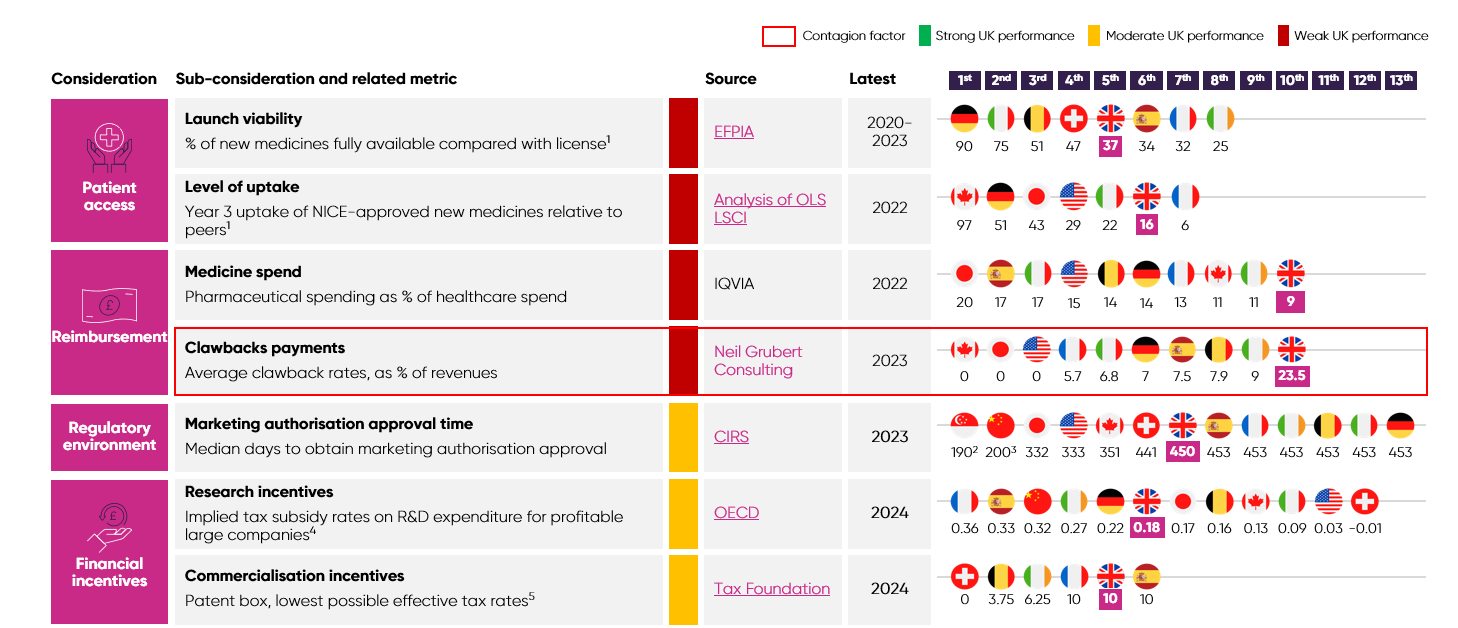
The UK invests significantly less in medicines, as a proportion of healthcare spending, than other developed countries. Specifically, the UK invests around 9% of its healthcare spend in medicines, compared with 17% in Spain.6
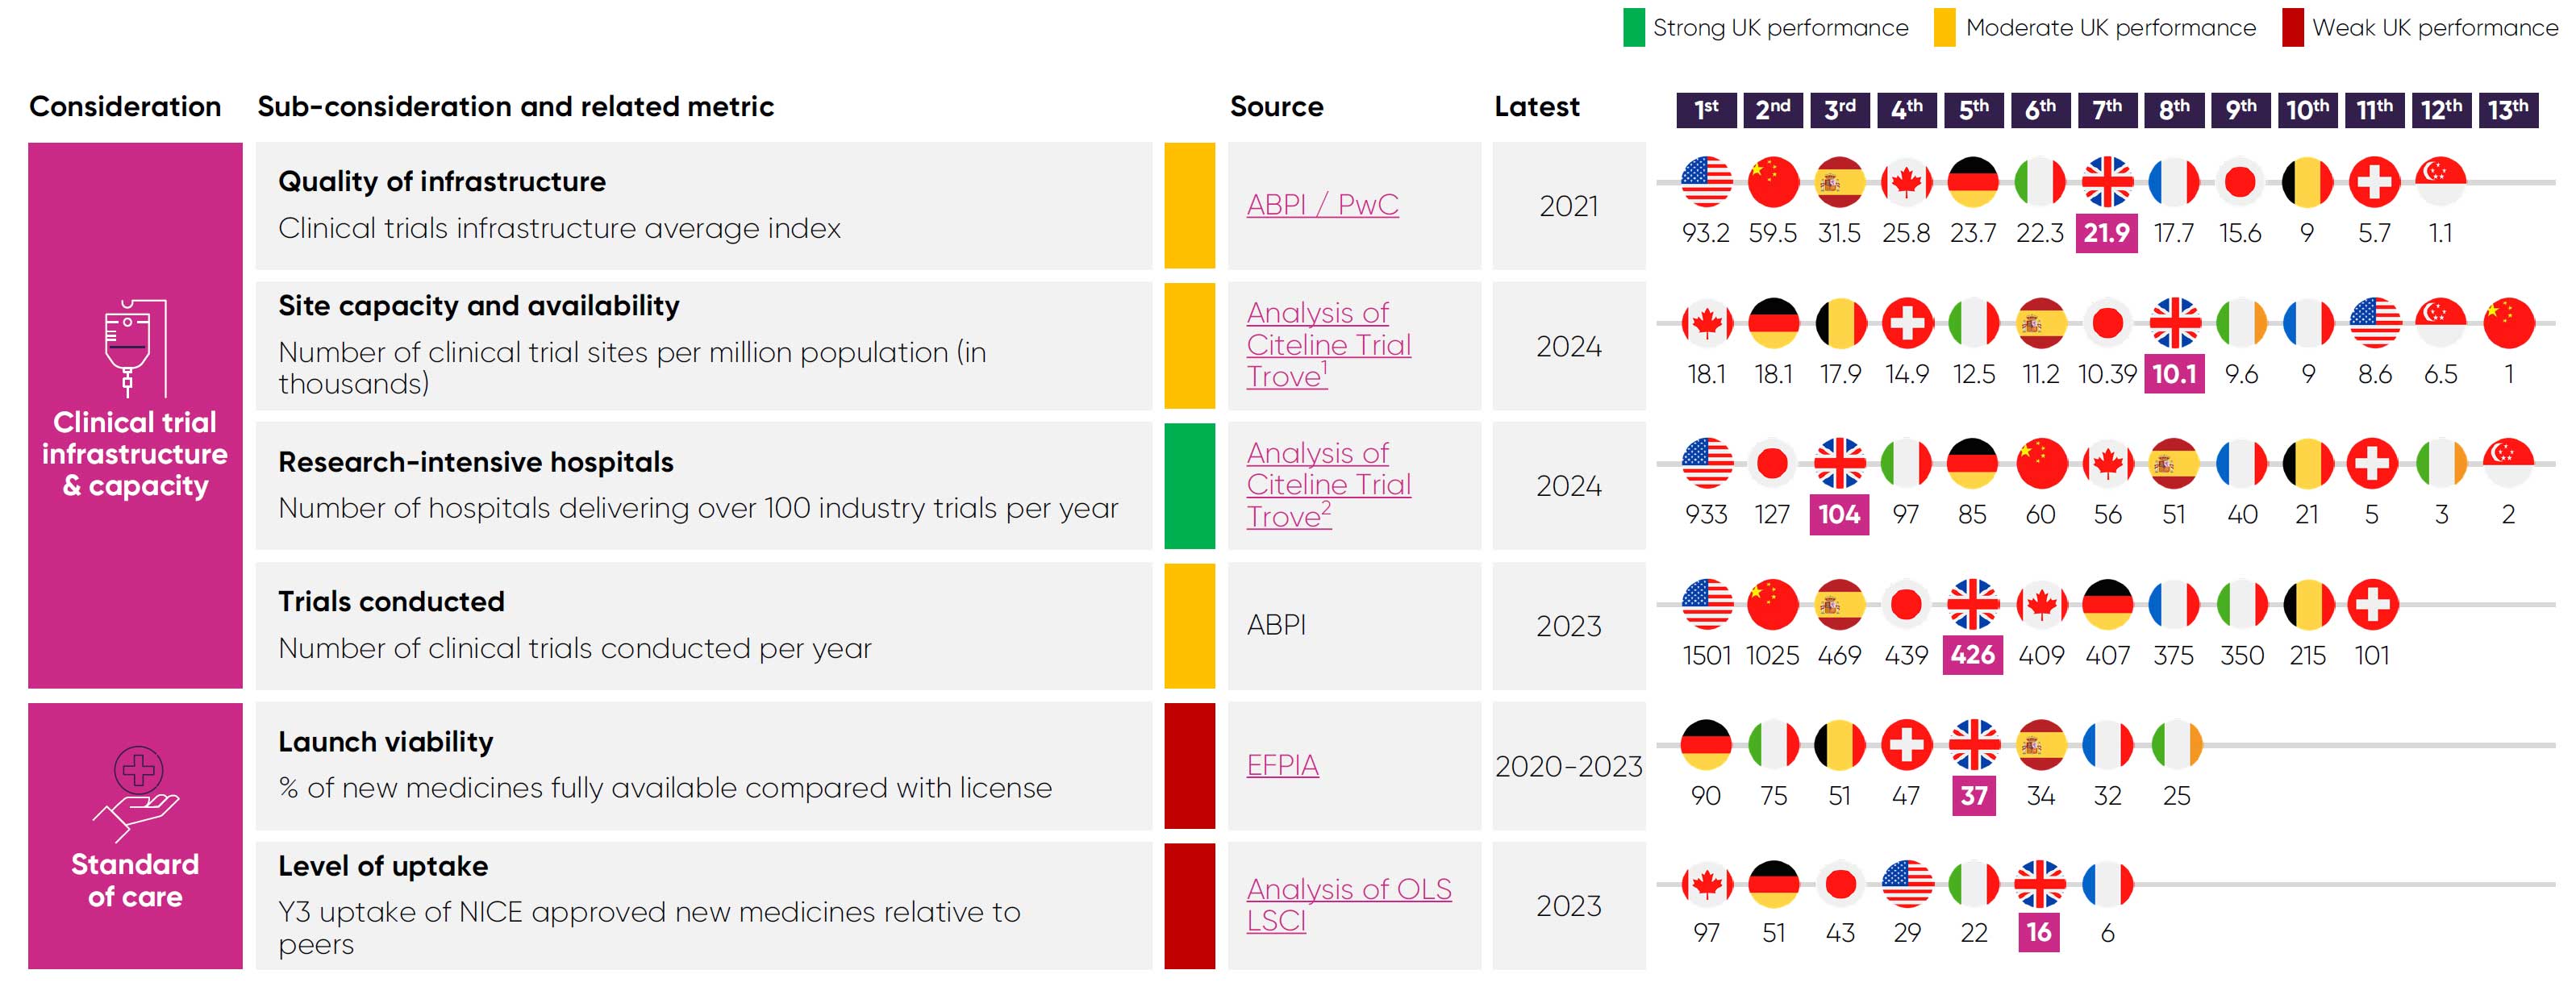
UK patients’ access is limited, as just 37% of new medicines are made fully available for their licenced indications, compared to 90% in Germany.7 ABPI data also shows that more than 60 medicines/indications did not launch in the UK or were delayed between 2019/20 and 2022/23.36 Nearly 70% of these decisions were made because of the UK’s pricing requirements, including NICE thresholds and the additional value for flexible commercial arrangements.36
New medicines made available in the UK also see far lower levels of uptake than comparable markets. Among the G7 nations, the UK has the second-lowest level of uptake three years after a medicine is approved.8 Moreover, levels of uptake in the UK vary dramatically from region to region, which contributes to health inequalities.9 These persistent, structural barriers to patient access and uptake of new medicines undermine the UK’s attractiveness to global investors. Specifically, pharmaceutical companies see these barriers as signs that the UK market prioritises cost containment and undervalues innovation.
More importantly, this approach to innovative medicines has major implications for the health of the UK’s population. The UK has much higher levels of treatable mortality (that is, deaths from causes that can be treated) than those seen in similarly developed countries that invest more in medicines and have higher levels of uptake.13
As such, addressing the UK’s underinvestment in innovative medicines would not only bolster the UK’s global competitiveness – it would also contribute to improved health outcomes.
Clawback rates
High clawback rates on pharmaceutical companies’ revenues have exacerbated the dampening of investor confidence caused by underinvestment in innovative medicines. As seen below, the UK is a global outlier:
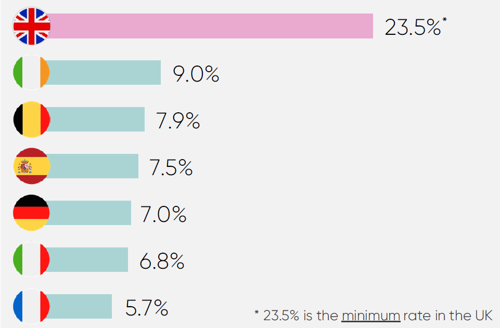
While this barrier to investment is not new, it has now reached a critical point.
In December 2024, the government announced the 2025 rate on branded newer medicines would increase to 23.5%, far above the predicted rate of 15.9%.
Crucially, this rate just sets the minimum payment that companies can pay on eligible revenue under the voluntary scheme. Companies with older medicines can face rates of up to 35%. Coupled with the statutory scheme’s rate doubling from 15.5% to 31.3% (which companies pay if they are not on the voluntary scheme), the 2025 rate announcement has severely degraded investor confidence in the UK.
Consequently, many global investors now view the UK as a contagion risk, with market practices that would render the global operating model for the industry unviable if adopted elsewhere. This renders new investment in the UK unviable across large parts of the industry and puts investment retention at risk also. Decisive action on this issue is essential, as analysis shows that high clawback rates risk both the retention and attraction of industry investment in the UK.37
if clawbacks remain above 20%37
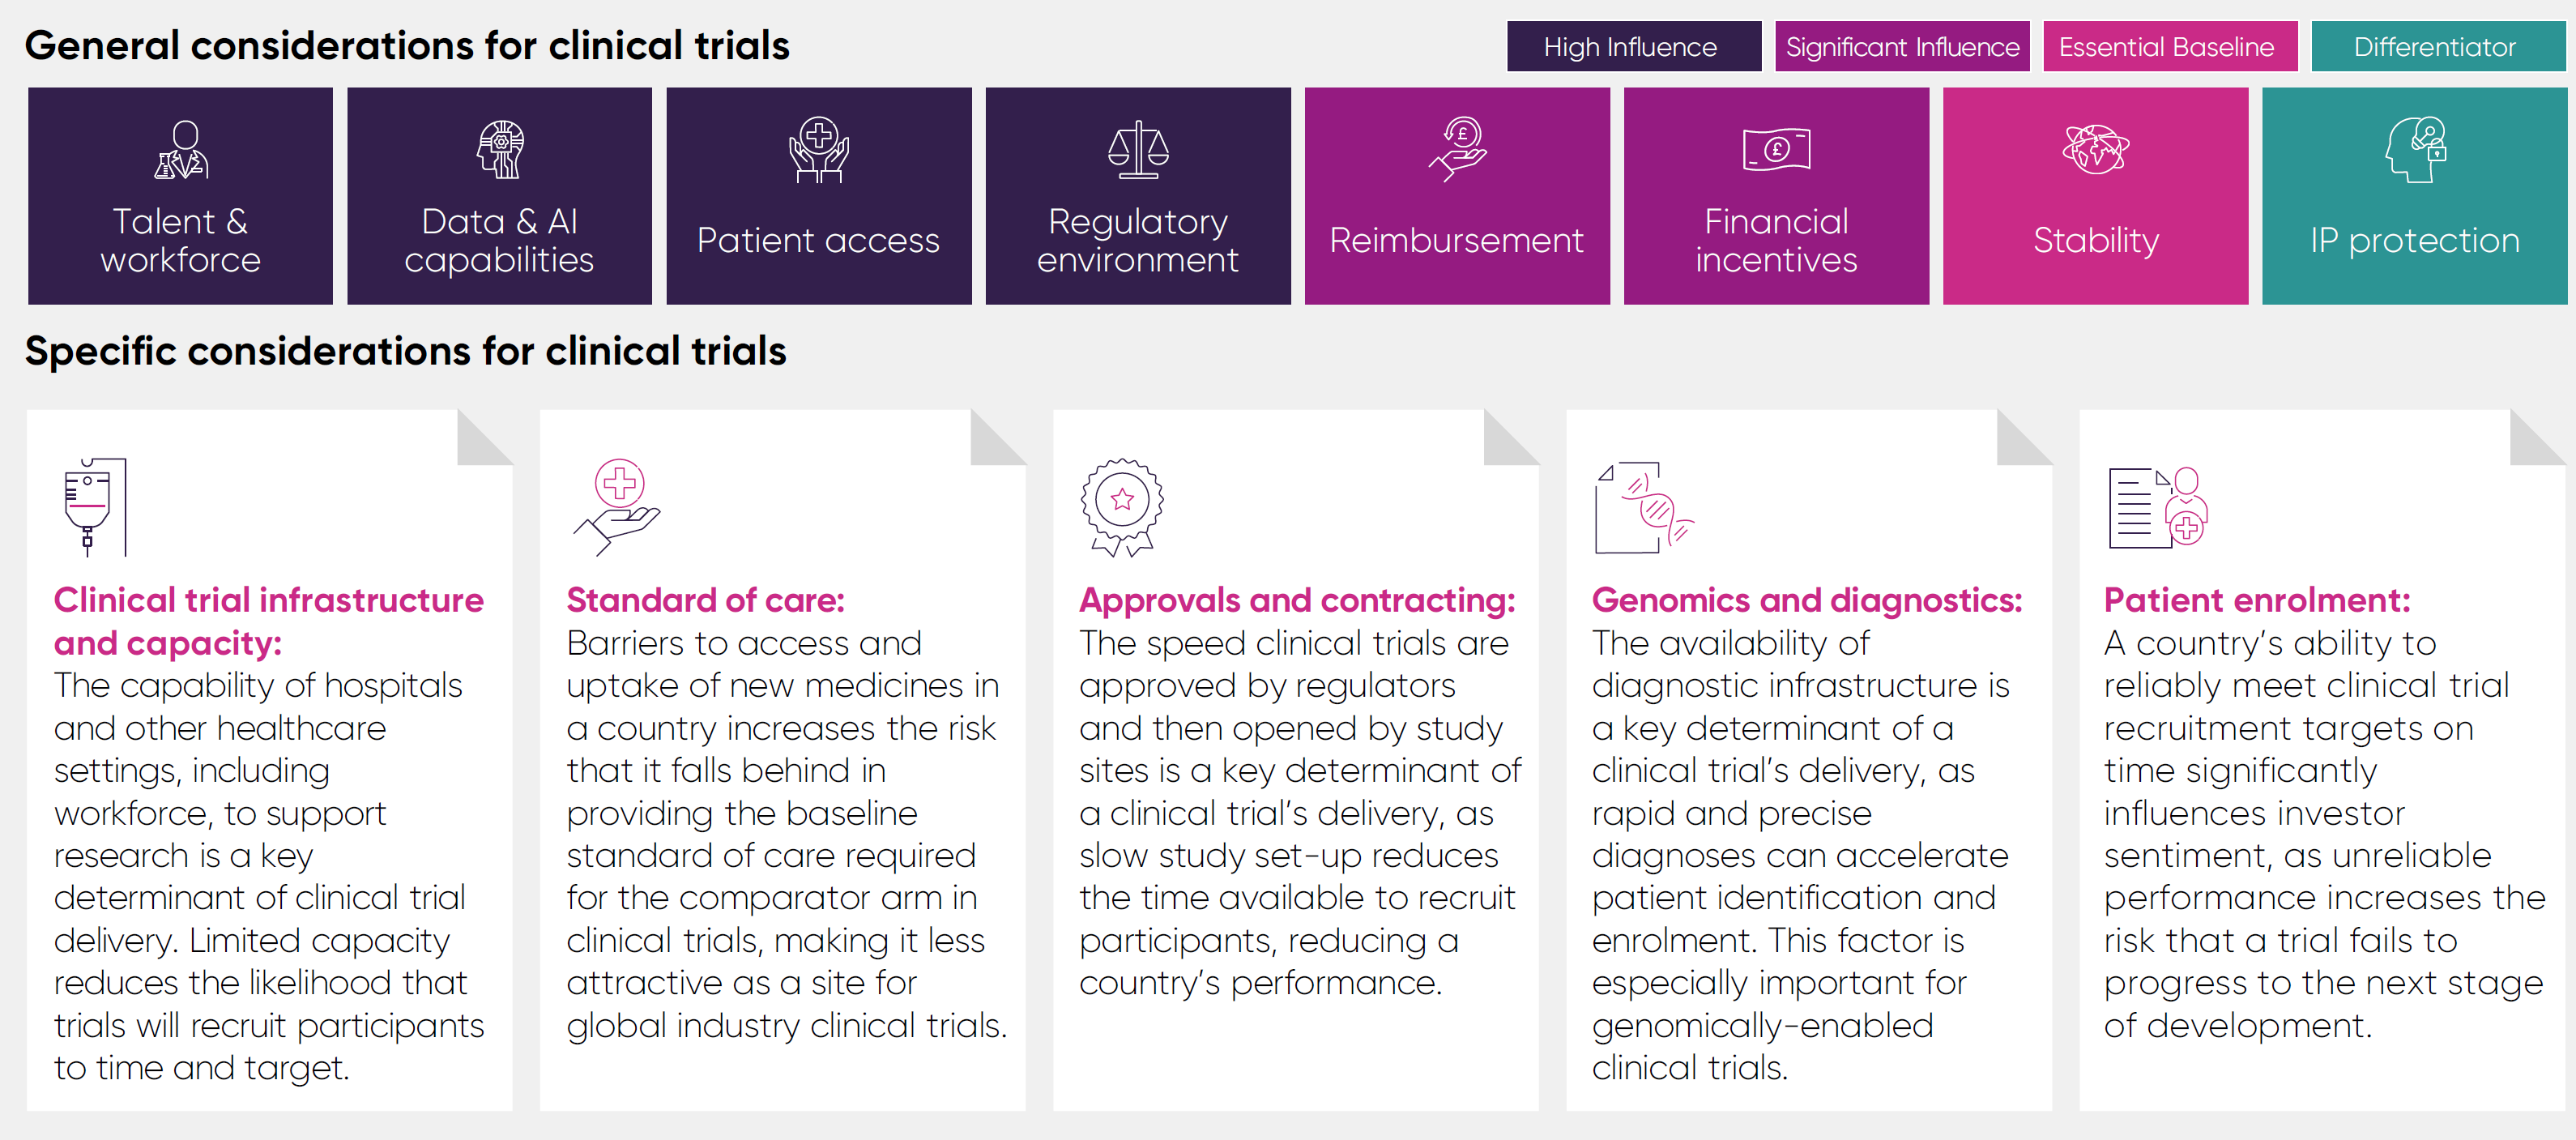
Clinical trial delivery
Clinical research has historically been a key UK strength, attracting inward industry investment. In 2017, the UK ranked 3rd, 2nd, and 4th in the world for phase I, II, and III industry trials.11

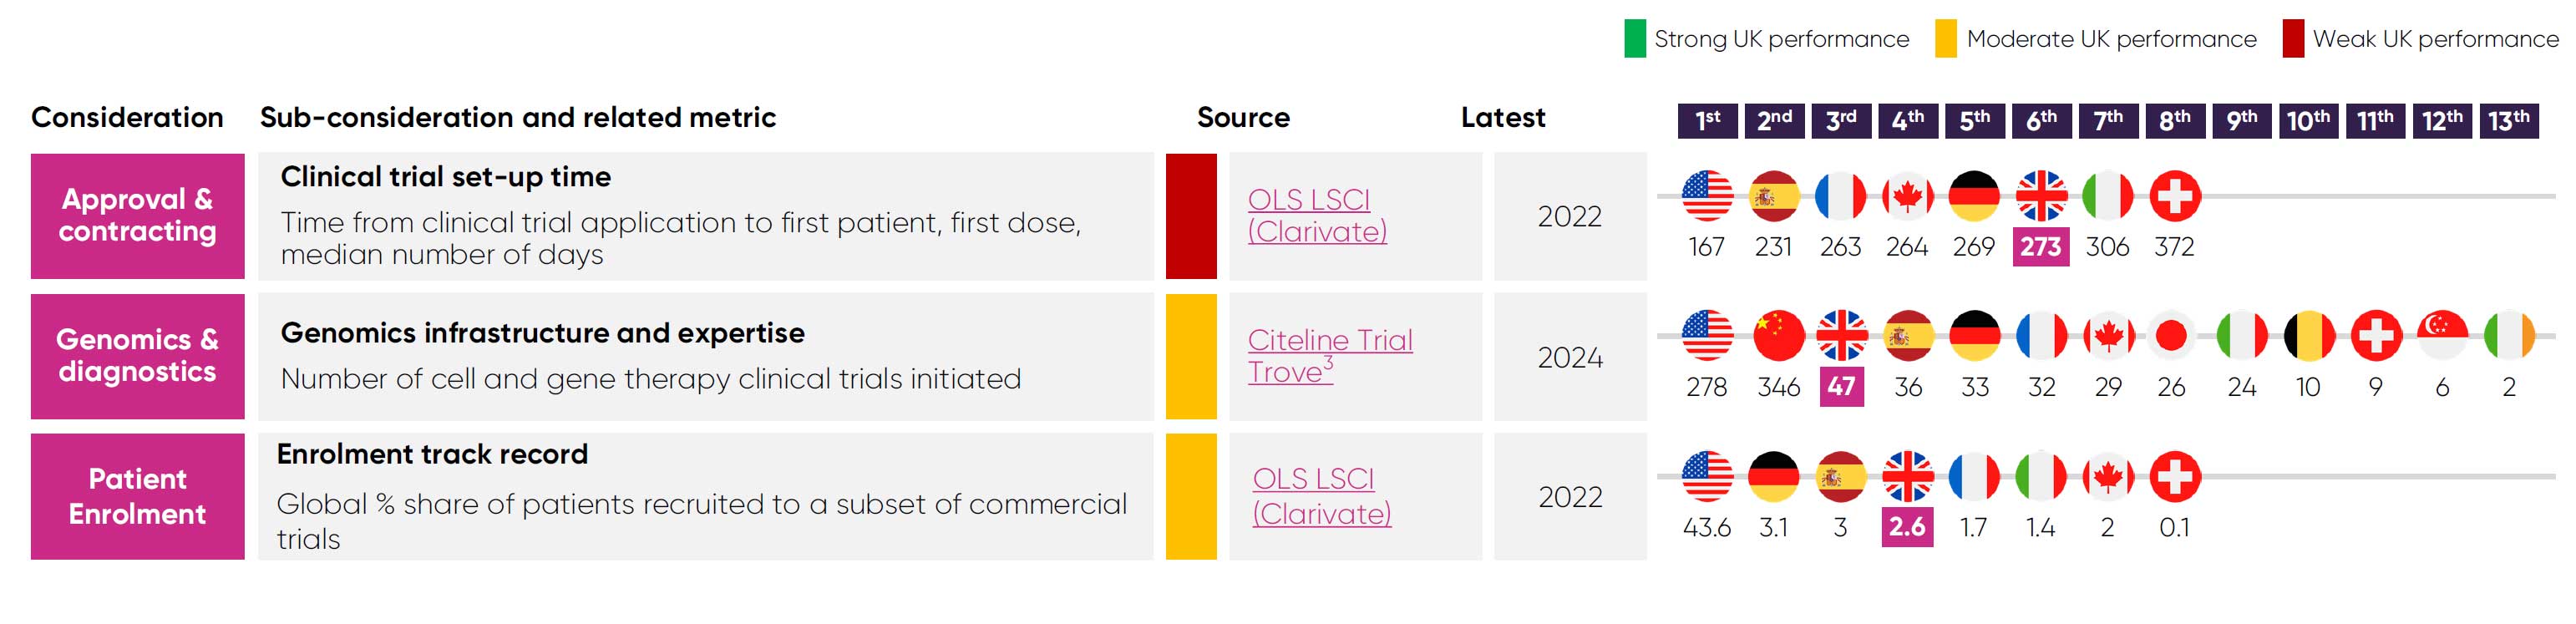
Since then, the UK’s competitiveness in industry clinical trial has steeply declined. Between 2017 and 2023, the UK’s global ranking for phase III industry trials fell from 4th to 8th11, while its share of global recruitment has fallen to 2.6% in 2022 from a peak of 4.2% in 2015.4
Constraints in the UK’s research capacity are a key cause of its diminished competitiveness. The UK now lags major competitors like Spain and Germany in many clinical trial capacity metrics.

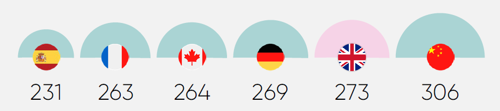
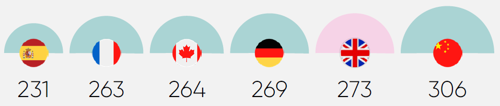
Limited capacity is a critical reason why the UK is slower at setting up clinical trials slower than its competitors, with a median time of 273 days.4 These delays reduce the time available to enrol patients, undermining the UK’s competitiveness.
Low uptake and restricted patient access also lowers investor confidence, as the UK’s standard of care risks diverging from the global standards used as comparator arms for industry trials.
The Prime Minister’s commitment to reduce trial set-up times to an average of 150 days is a positive step towards rebuilding investor confidence. Coupled with industry investment in clinical trial capacity,38 there is an opportunity to capitalise on recent signs of recovery 11 if the government and industry work together to tackle structural barriers to investment.
- £3.0 billion additional GVA generated
- £485 million additional NHS revenue
- 25,000 new jobs
Competitor countries at a glance
WHO: World Health Organization
Chapter 3
What are the areas of unrealised potential?
Despite these challenges, the UK has several areas of potential that have not yet been fully realised and could enhance its competitiveness. Its leadership in advanced therapies offers a strong foundation to anchor high-value R&D and manufacturing. Continued investment in health data and AI, areas of growing importance for investors, can further enhance the UK’s appeal. Targeted reform of the MHRA also presents a clear opportunity to position the UK as a more agile and reliable for global launches.
While none of these shifts will happen overnight and must be coupled with clear action to address the fundamental barriers to investment identified in this framework, they represent focused, high-impact areas where the UK can regain a competitive edge.
Areas of unrealised potential
Despite current challenges, the UK has clear areas of strength that, with targeted reform, could become competitive differentiators.
These opportunities lie in domains where the UK already has demonstrated technical, scientific or policy leadership, including health data, advanced therapies, and regulatory science.
With effective and sustained support, they offer the potential to reposition the UK as a more attractive destination for investment.
Health data and AI
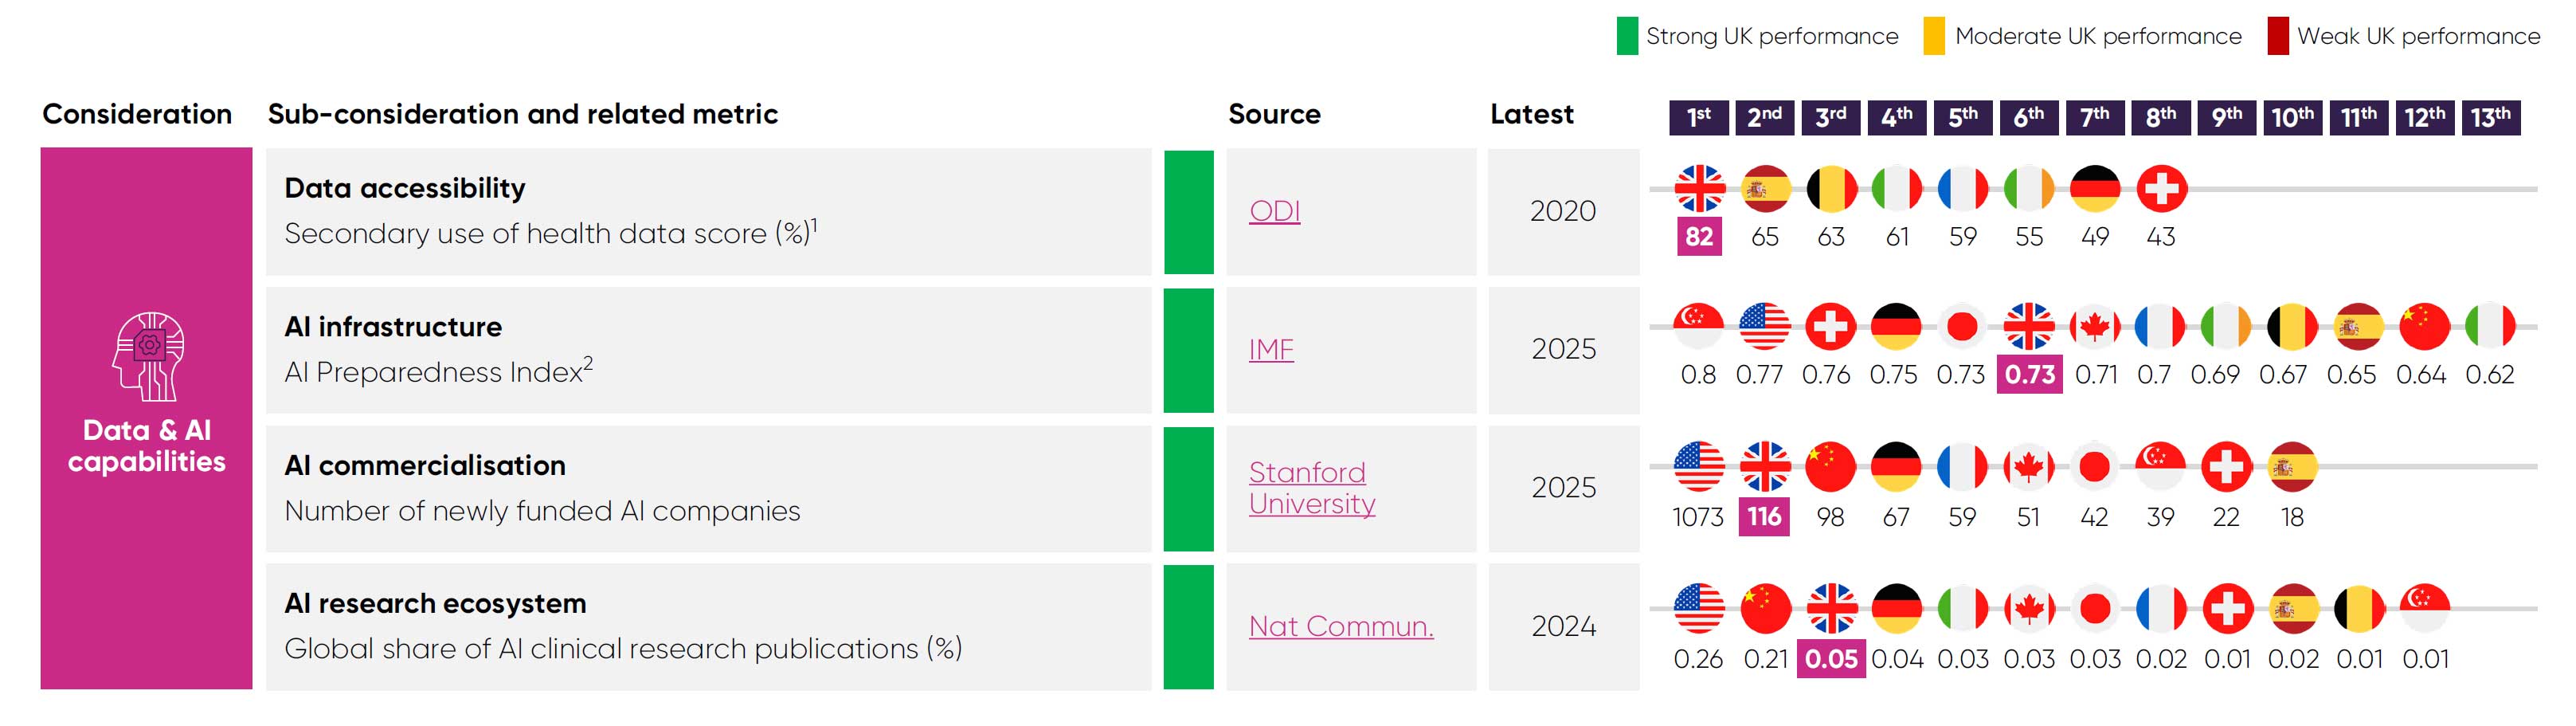
The UK’s health data assets and expertise in AI are core assets that could attract further life sciences investment. The UK ranks among Europe’s top performers for secondary use of health data48 and is supplemented by worldclass resources such as the UK Biobank.
The UK also has strong potential in AI. It ranked 3rd in Europe for AI preparedness in 202363 and attracted £4.5 billion in private AI investment in 2024, behind only China and the US.49 This potential is already being translated into commercial opportunities, with 116 AI firms newly funded in the UK in 2025 – ranking global 2nd.49
However, access to data for research purposes remains hindered by siloed data assets and fragmented infrastructure across the health and care system.51 Several attempts to address this over the past decade have fallen short in streamlining the UK’s health data ecosystem, during which other nations have increased their capabilities.
With continued investment and improvements to data accessibility, quality and linkage, the UK could significantly enhance its appeal as a destination for data-driven innovation.
Advanced therapies
While the UK runs fewer industry trials than some peers, it leads in advanced therapy trials. For example, UK-based cell and gene therapy (CGT) companies raised around £200 million of venture capital in 2023,52 which enabled the UK to initiate 47 CGT clinical trials in 2024.12
Furthermore, 9.5% of the world’s advanced therapy trials are recruiting patients in the UK,53 far exceeding the UK’s 2.6% share of global recruitment to industry trials more broadly.4
This leadership in innovation presents a clear opportunity to scale manufacturing capacity, capture more of the global supply chain, and attract long-term investment to the UK.
Capacity to manufacture advanced therapies in the UK has grown rapidly from 31,800 square metres in 202164 to 51,800 in 2024.65 This includes cleanrooms, which grew even more rapidly from 10,200 square metres in 2020 to 15,700 in 2024.66 Additionally, the advanced therapy workforce has doubled in size since 2020, standing at over 6,000 employees.65 These investments give the UK a credible platform for future growth.
Despite this, the UK is still missing out on big ticket advanced therapy investments. Many companies do not want to run CGT trials in the UK due to concerns that the current access environment will prevent them from launching new innovative therapies in the UK’s market.
To build on its strong foundations and become a global hub for advanced therapies, the UK must enable a viable pathway to market, with appropriate reimbursement for advanced therapies. The UK must also ensure its fiscal incentives (including tax and capital grants) are at the levels needed to compete for large-scale capital investments in R&D and manufacturing.
Regulation
Speed, predictability and reliability in regulatory processes are key determiners for where companies locate R&D activity, manufacture medicines and vaccines, and launch products.
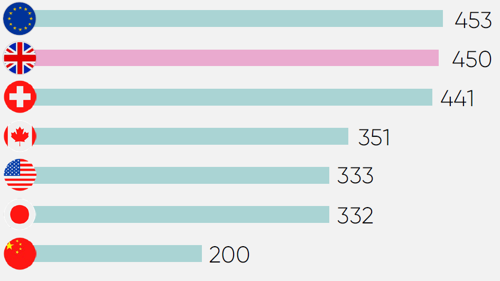
The UK has suffered from significant challenges in meeting statutory regulatory processing timelines in the wake of COVID-19, EU exit, and agency restructuring. Average marketing authorisation timelines reached 450 days54 in 2023, placing the UK near the back of the comparator group.
However, there are signs of recovery, as steps are being taken to improve processing speeds, innovative regulatory pathways are being redeveloped, and the International Recognition Procedure is achieving efficiency gains.
There is a clear opportunity to improve the UK’s attractiveness to investors by building on these positive first steps, particularly with the integration of digital and AI tools to reduce friction further.
The global influence and relevance of a regulator can also be a major determiner of where companies set up affiliate bases and recruit expert regulatory staff. This can be achieved by establishing the UK as a launchpad regulator for other major global markets.55
For example, the UK’s membership of the Access Consortium (a global consortium of national regulatory agencies) could be capitalised on by expanding other markets’ recognition of regulatory decisions made in the UK.
Competitor countries at a glance
Competitiveness Framework
Data and international comparisons


This framework provides a clear and structured approach for users to assess the UK's performance compared to other leading nations.
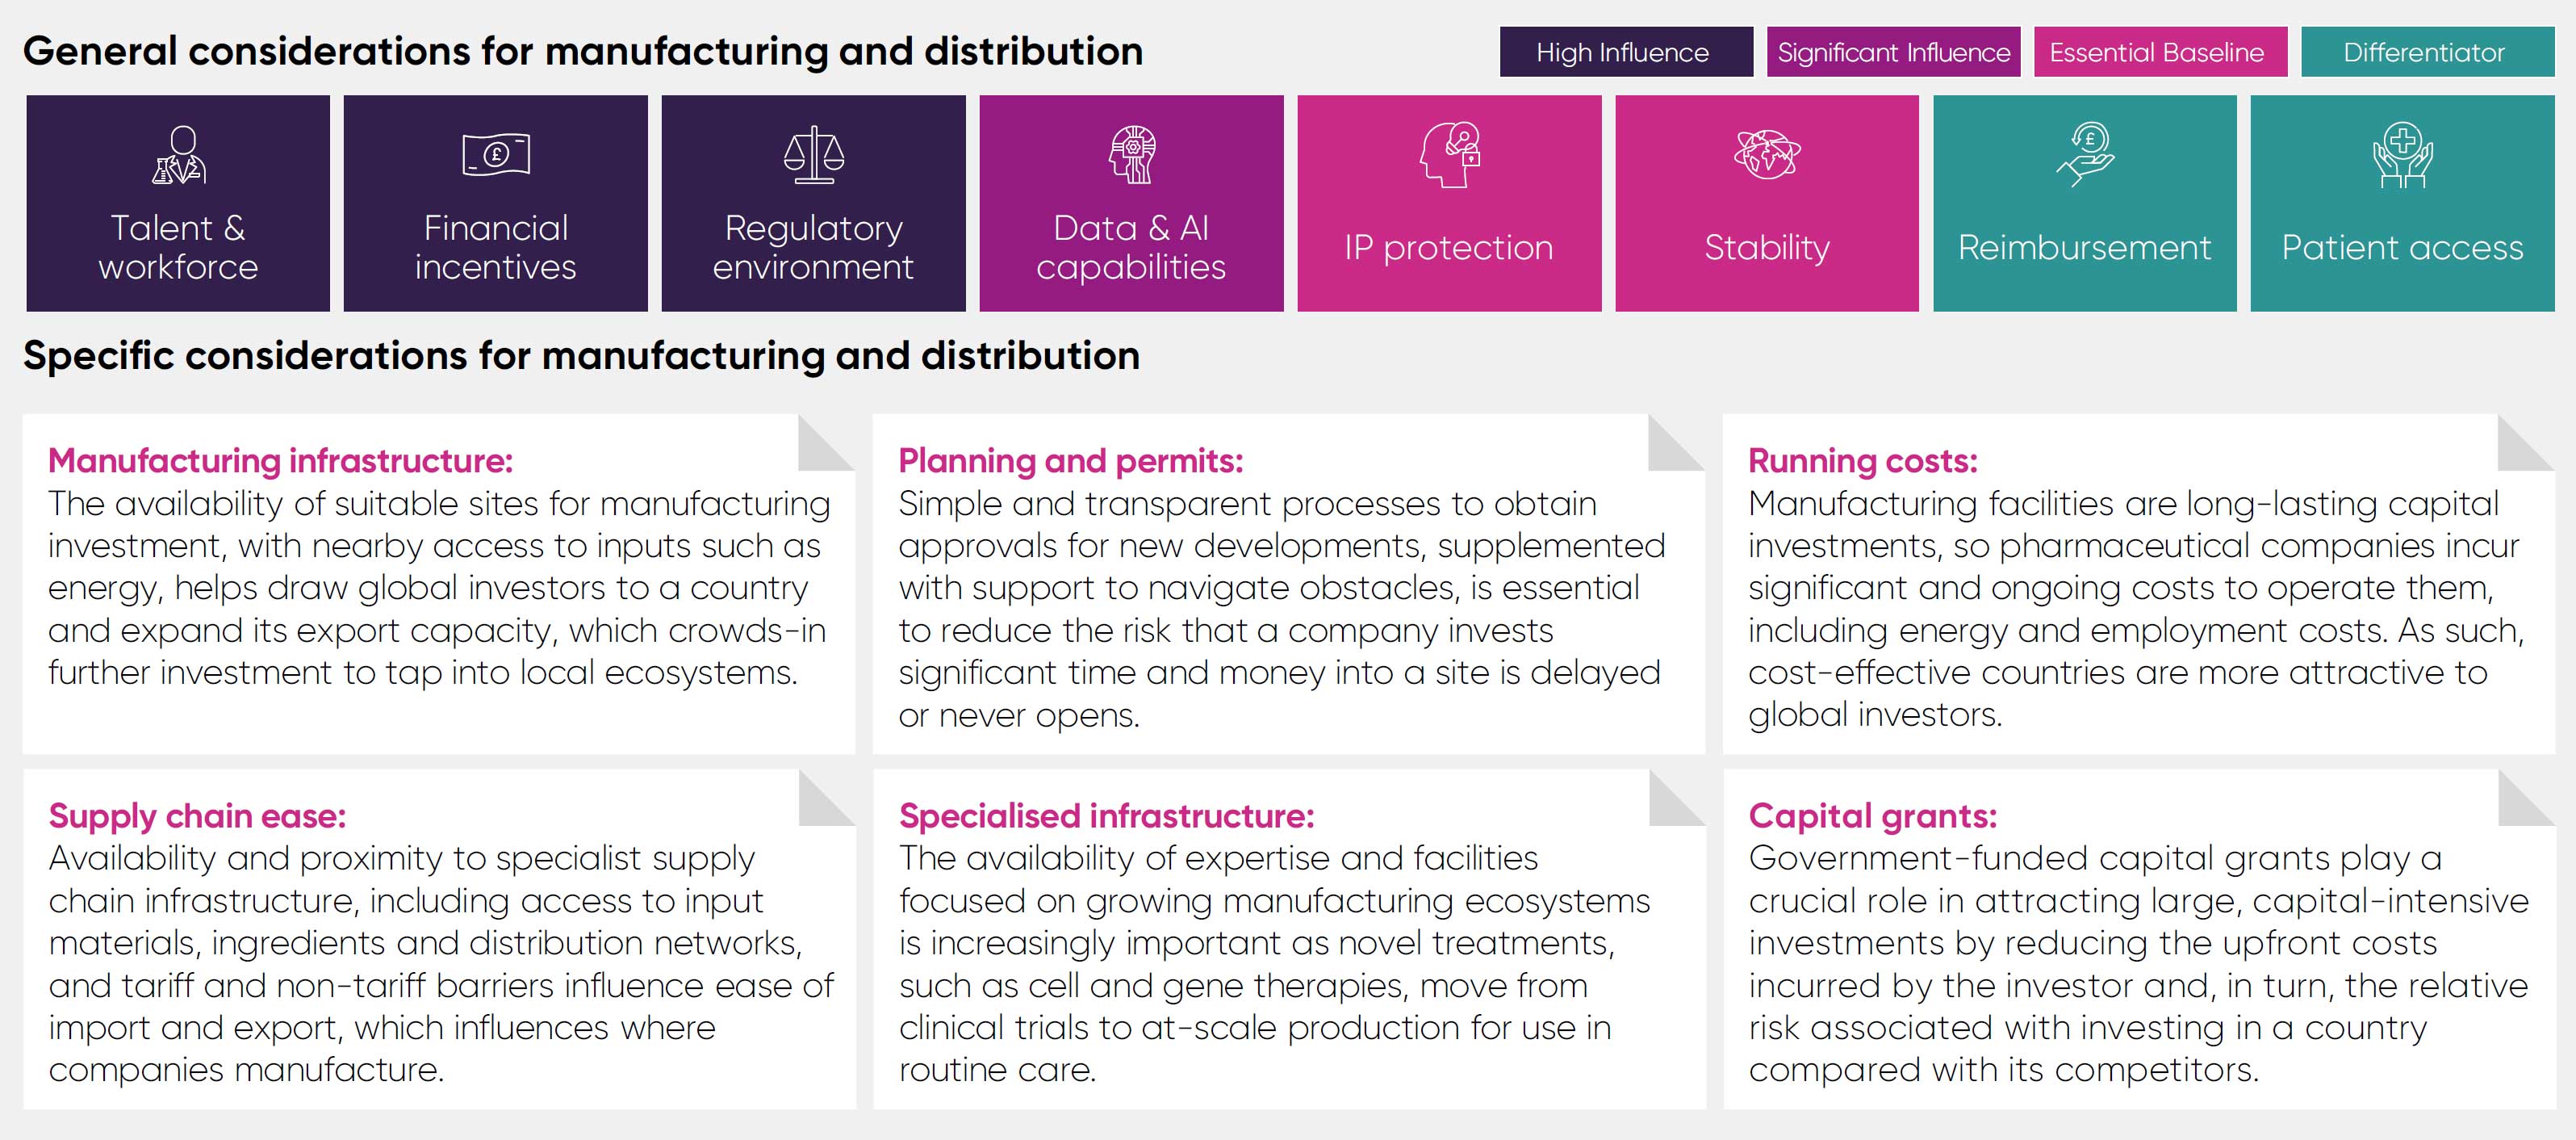
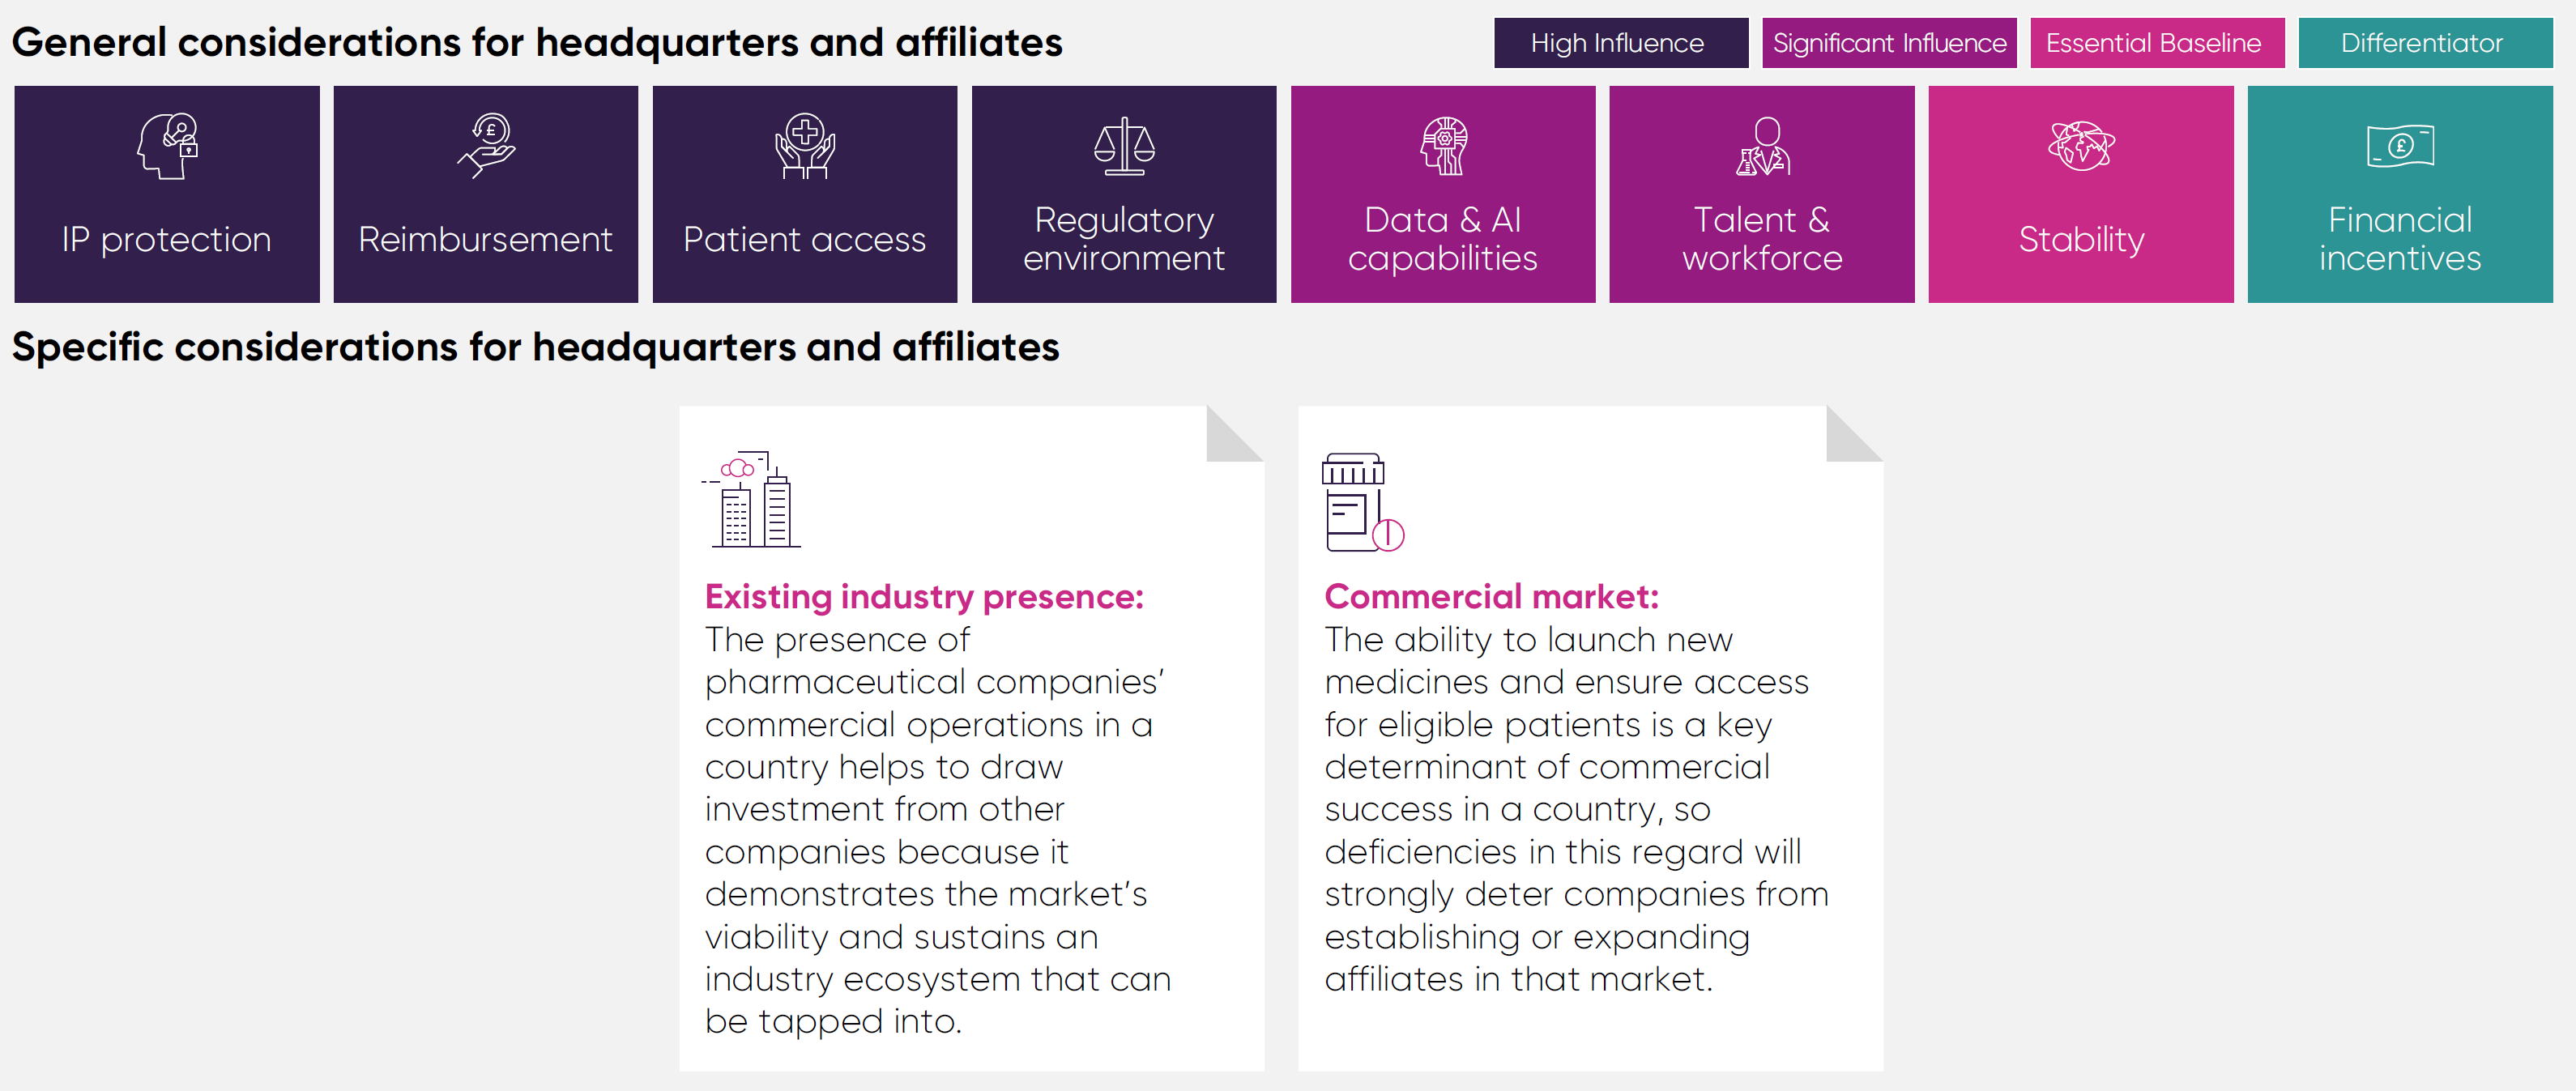
It is structured around two main types of investment considerations: specific considerations tailored to four distinct investment areas, and general considerations that apply broadly across all categories.
The significance of general considerations varies according to the investment area in question. For instance, government incentives play a critical role in assessing the viability of manufacturing investments but may be considered secondary or serve as differentiators in other areas. The framework explicitly outlines how each general consideration applies to different investment categories.
Given that country performance can differ considerably from one metric to another, rankings alone may not fully capture comparative performance. To provide clarity and depth of understanding, the framework includes detailed raw performance data alongside rankings and offers a concise performance summary using a red-amber-green rating system.
Countries not included in the analysis have been omitted due to insufficient data availability; this absence should not be interpreted as indicating superior or inferior performance.
General considerations identified are factors that are applicable to all investment types. For each investment category, the framework provides an assessment of the importance and relationship between these considerations and investment attractiveness, recognising that for some investment types these factors are primary considerations with direct relevance, and for others they serve as a differentiator that can tip the balance in favour of a particular location.
Talent and workforce: Access to a highly skilled workforce is crucial to all areas of investment, as business operations throughout the whole pharmaceutical value chain all rely on skills and knowledge that in many cases require years of training to develop.
Political and economic stability: Many areas of pharmaceutical industry investment operate on multi-year, and even multi-decade, timespans, so instability in a country’s policy landscape or economy acts as a strong deterrent against inward investment.
Intellectual Property protection: A strong IP framework is foundational to industry investment in the high-risk, lengthy process of discovering and developing new medicines that make it to market, as it protects them from unfair competition for a limited period.
Patient access: The ability of patients to access treatments and healthcare that they are eligible to receive has a significant bearing on industry investment, as a lack of uptake makes investments in areas such as clinical trials challenging to deliver.
Reimbursement: Countries that reward and invest in innovation for the benefit of their population’s health and economy are much more attractive as destinations to invest and do business because there is less risk that investments will fail to yield a sufficient return.
Regulatory environment: The speed and reliability of a regulator can markedly affect the clinical development of innovative products, the timely opening of a new manufacturing site, or the launch of a medicine, with knock-on effects for future investments if key decisions are delayed.
Financial incentives: Policies like R&D tax credits help to incentivise investment by reducing upfront costs and the perceived risk of undertaking a medicines development programme, resulting in more R&D than there would be in the absence of incentives.
Data and AI capabilities: Pharmaceutical companies are leveraging health data and artificial intelligence to conduct R&D more efficiently and plan their business strategies at an accelerating rate, meaning countries with these capabilities will become increasingly competitive.
Notes: (1) Cost for LMIA GTS used. Alternatively, a Post-Grad Open Work Permit costs £148, (2) Not included in original source so supplemented from UK Home Office, (3) Not included in original source so supplemented from Ireland Gov., (4) Cost for H1B Speciality Occupation Visa. Alternatively, a O-A1 Individuals with Extraordinary Ability costs £3687
Notes: (1) These metrics have been included despite not meeting all inclusion criteria as they are very high value for understanding investor sentiment towards the UK, (2) Not in original source, supplemented from Singapore HAS. Range of 120-160 days were quoted and additional 50 days for screening, so an average was taken, (3) Not included in original source so supplemented from China NPMA, (4) Firm size is large, profitable companies, (5) The different patent box systems have varying scopes and eligibility requirements hence minimum rates are illustrative.
Notes: (1) Metric does not include non-European countries, and the methodology gives a score to a range of different factors but does not provide a weighting which may skew the UK’s position, (2) The AIPI value is the sum of four key dimensions: digital infrastructure, human capital, tech innovation and legal frameworks. Each dimension is computed by normalizing and averaging a set of sub-indicators, including STEM expertise, sustained human capital investment, labour & capital mobility, vibrant R&D ecosystem & adaptability of legal frameworks.
Notes: (1) The nature index includes the absolute count of article publications at a national level. The journals included in the Nature index were selected by researchers that publish in the natural sciences, who were asked to list the journals in which they would most like to publish their best work. This list is intended to be a reasonably consensual upper echelon of journals in natural sciences and health sciences.
Notes: (1) Count of sites obtained by filtering Trial Trove results to include trials initiated in 2024, tagged as ongoing / completed. Value then divided by country population. (2) Sites obtained by filtering Trial Trove results to include trials initiated in 2024, tagged as ongoing / completed. Those delivering 100+ trials were counted. (3) Count of trials obtained b filtering Trial Trove results to include trials initiated in 2024 that are ongoing / completed involved a Cellular or Gene Therapy.
Notes: (1) Count of sites obtained by filtering Trial Trove results to include trials initiated in 2024, tagged as ongoing / completed. Value then divided by country population. (2) Sites obtained by filtering Trial Trove results to include trials initiated in 2024, tagged as ongoing / completed. Those delivering 100+ trials were counted. (3) Count of trials obtained b filtering Trial Trove results to include trials initiated in 2024 that are ongoing / completed involved a Cellular or Gene Therapy.
Notes: (1) China’s value is lower than expected because most APIs are included under the organic chemicals or other chemical chapters within the ITC definitions.
Notes: (1) Data shown to represent the UK is England only and based on National Institute for Health and Care Excellence (NICE) decisions. NICE decisions are also recognised by Wales, and Northern Ireland. Separate data for Scotland is available in the original source.
Appendix
Methodology and references


References
- ONS, ‘Regional gross value added (balanced) by industry: all
International Territorial Level (ITL) regions’, April 2024. - ONS, ‘Census 2021: Industry’, December 2022.
- ONS, ‘Business enterprise research and development UK: 2023’,
December 2024. - OLS, ‘Life Sciences Competitiveness Indicators, 2024’, July 2024.
- ABPI analysis of ONS ‘business expenditure on research and
development UK: 2023’ available upon request and IFPMA ‘Always Innovating’. - IQVIA, unpublished analysis.
- IQVIA, ‘EFPIA Patients W.A.I.T Indicator 2024 Survey’, May 2025, available here. Data used here is England only and relates to NICE decisions.
- ABPI analysis of OLS ‘Life Sciences Competitiveness Indicators, 2024’, available upon request. Data used for this metric is England only.
- NHS Confederation, ‘Transforming lives, improving health outcomes’, January 2023.
- Analysis undertaken by Neil Grubert Consulting, available on request.
- ABPI, ‘The road to recovery for UK industry clinical trials’, December 2024.
- PwC analysis of Citeline ‘Trialtrove’.
- OECD, ‘Avoidable mortality’, July 2025.
- UNESCO Institute for Statistics, ‘Percentage of graduates from tertiary education graduating from Natural Sciences, Mathematics and Statistics programmes, box sexes (%)’, July 2025.
- UK Government, ‘Life Sciences Sector Plan’, July 2025.
- QS Top Universities, ‘QS World Rankings by Subject 2025: Life Sciences and Medicine’, March 2025, available here.
- Lightcast, ‘Life Sciences 2035: Developing the skills for Future Growth’, March 2025.
- Nature, ‘Nature Index: Health Sciences’, May 2025.
- The Royal Society, ‘Summary of visa cost analysis, 2024’, August 2024.
- Biotechgate, ‘Countries Covered’, July 2025.
- Royal Academy of Engineering, ‘Spotlight on Spinouts’, February 2025.
- BIA, ‘UK biotech financing, 2024’, January 2025.
- Property Rights Alliance, ‘2024 International Property Rights Index: Switzerland’, October 2024.
- WIPO, ‘Global Innovation Index 2024’, June 2024.
- IMD, ‘World Competitiveness Ranking 2025: Switzerland’, June 2025.
- Science Industries Switzerland, ‘Overview and position on free trade and international market access’, March 2025.
- Interpharma, ‘Health Panorama 2024’, September 2024.
- Property Rights Alliance, ‘2024 International Property Rights Index: China’, October 2024.
- World Bank, ‘Current health expenditure (% of GDP): China’ July 2025.
- PwC, ‘Navigating China’s pharmaceutical industry landscape’, February 2025.
- IMD, ‘World Competitiveness Ranking 2025: China’, June 2025.
- The pharma letter, ‘Joining ICH, China FDA embraces global community of regulators’, August 2017.
- Fierce Pharma, ‘AstraZeneca, Sanofi, Lilly, Pfizer CEOs meet with Xi Jinping amid US-China trade tensions’, March 2025.
- Nature ‘Analysis of China-to-West pharmaceutical licensing deals in 2024’, April 2025.
- IMD, ‘Global pharma invests in China on the strength of a booming national biotech sector’, February 2024.
- ABPI analysis of NICE appraisal data and ABPI survey data, available upon request
- WPI Economics, ‘Opportunity unlocked: How UK medicine spend policy can free the life sciences sector to drive growth’, June 2025.
- ABPI ‘Delivering a voluntary scheme for health and growth’, March 2025.
- PwC, ‘Life Sciences Superpower: Growing leading global hub in the UK’, June 2022.
- Frontier Economics, ‘The value of industry clinical trials to the UK, Extended report’, December 2024, available here.
- Medicamentos Innvadores. ‘Investigación Clinica’, December 2024.
- Research Professional News, ‘Spanish science ministry hails ‘historic’ budget increase’, January 2021.
- Research Professional News,’Spanish government boosts R&D budget by a third’, May 2024, available here.
- Instituto Nacional de Estadistica, ‘R&D Statistics’, November 2024.
- Property Rights Alliance, ‘2024 International Property Rights Index: Singapore’, October 2024.
- LEK, ‘Unlocking Growth: Singapore’s Role in Advancing Life Sciences and Medtech Innovations’, March 2025.
- WHO, ‘Landmark listing of first three countries as WHO-Listed regulatory Authorities’, October 2023.
- ODI, ‘How well is your country doing on policy for secondary use of health data?’, September 2021.
- Stanford University, ‘Artificial Intelligence Index Report 2025’, April 2025.
- UK Government, ‘Prime Minister turbocharges medical research’, April 2025.
- ABPI and HDRUK, ‘Options appraisal to deliver a health data research service in England’, January 2025.
- BIA, ‘UK cell and gene therapy’, January 2024.
- Cell and Gene Therapy Catapult, ‘70% increase in Phase I advanced therapy clinical trials in the UK in 2024’, January 2025.
- CIRS, ‘New drug approvals in six major authorities 2014-2023’, July 2024.
- ABPI. ‘Enhancing the role of UK medicine regulation’, December 2024.
- Leem, ‘Bilan économique des enterprises du médicament – Edition 2024’, March 2025.
- Leem & CEPS, ‘Leem and CEPS sign a new three-year framework agreement’, March 2021.
- Ministère de l’économie des finances et de la souveraineté industrielle et numérique, ‘Relocalisation des médicaments essentials’, January 2025.
- Fierce Pharma ‘Sanofi, Pfizer, AstraZeneca invest a combined €1.87B to bolster operations in France’, May 2024.
- MMIP, ‘Follow the green, high-tech road’, June 2023.
- RTE, ‘IDA Ireland brand ‘misquoted’ and ‘confused’ review found’, November 2024.
- PwC, ‘Worldwide Tax Summaries, Ireland: Corporate’, February 2025.
- IMF, ‘AI Preparedness Index’, April 2024.
- Cell and Gene Therapy Catapult, ‘Annual Review 2023', November 2023.
- Cell and Gene Therapy Catapult, ‘Annual Review 2024, September 2024.
- Cell and Gene Therapy Catapult, ‘Cell and Gene Therapy GMP Manufacturing in the UK’, November 2024,.
-
ThemeValue
-
KeywordsVPAG
-
PublisherABPI
Related content

News |
VPAG payment rate for newer medicines will be 14.5% in 2026
The government has announced that the 2026 payment rate for newer medicines under the Voluntary Scheme for Branded Medicines Pricing and Access (VPAG) will be 14.5 per cent, down from a record 22.5 per cent in 2025.

News |
Companies granted third extension to VPAG 2026 decision deadline – now set for 16 December
The ABPI and the government have agreed to a further extension to the deadline by which companies must give notice if they intend to leave the 2024 voluntary scheme for branded medicines pricing, access and growth (VPAG). The revised deadline for submitting notice to leave the VPAG scheme is now 16 December 2025.

News |
ABPI calls for Budget action to revive UK life sciences investment
The ABPI has used its pre-Budget submission to urge the government to take urgent steps to reverse a decade-long decline in investment and restore the UK’s position as a global leader in life sciences.