Foreword
A year ago, the UK was losing ground in the global race for pharmaceutical investment. Today, the picture is more hopeful. Through a real partnership between government and industry, we have started to turn a trend of disinvestment into one of green shoots, with £2 billion of new investment committed over the past year alone. But this recovery is not yet secure.
Investors make decisions that play out over decades, and they are watching closely to see whether the UK delivers on the commitments it has made. The task now is to provide and proceed along a clear, reliable roadmap to delivery so companies can invest with confidence. Get this right, and the UK can unlock tens of thousands of high-value jobs, billions of pounds of growth, and faster access to new medicines for NHS patients.

Dr Richard Torbett MBE
Chief Executive, Association of the British Pharmaceutical Industry
Executive summary
A thriving pharmaceutical industry could add tens of thousands of high-value jobs and billions of pounds of economic activity across every part of the UK over the next decade – but capturing that prize is far from guaranteed.
The previous edition of this report identified enduring, critical weaknesses that were undermining the UK's competitive strengths. This longstanding risk to the UK's competitiveness materialised in the form of several major disinvestment decisions made throughout 2025.
Over the past year, however, the UK has begun taking meaningful steps towards rebuilding its attractiveness as a global destination for pharmaceutical investment. Through collaboration between industry and government, and a combination of short- and long-term policy commitments, the picture is improving. A trend of disinvestment has changed to one of green shoots, with several significant pharmaceutical industry investment commitments recently announced.
While positive, now is not the time for complacency. If investment and growth are to accelerate at pace with the ambitions set in the Life Sciences Sector Plan, industry decision-makers must have complete confidence in the UK's ability to deliver its policy commitments. Providing a clear and reliable roadmap to delivery is vital if the UK is to compete in a more geopolitically complex, competitive and crowded global market.
The size of the prize is significant. The pharmaceutical industry already supports more than 125,000 jobs across all UK nations and regions, but it could create as many as 81,300 new jobs by 2035 if business investment and growth accelerate.

81,300
new jobs by 2035 across the UK
This would represent a 64 per cent increase in headcount, expanding the pharmaceutical workforce to approximately 200,000 people across all corners of the UK, and translate into £33.4 billion of direct Gross Value Added per annum – up from £20.4 billion today.

↑ £33.4bn
GVA generated per annum up from £20.4 billion
What has changed since last year?
◆ The UK has retained the competitive strengths identified in the 2025 edition of this report, including its science base, domestic talent and intellectual property policy framework. Yet, several of these structural capabilities are at risk of being eroded and will take years to rebuild if the UK does not act proactively to enhance them in the face of growing competition.
◆ The UK is making progress to address the key competitive weaknesses that have deterred investment. This includes commitments that begin to address the UK's narrow access to, slow adoption of and underinvestment in innovative medicines and vaccines. Translating this progress into improved investment competitiveness requires the government to reliably deliver on its policy commitments over the long run.
◆ The UK can boost inward investment by enhancing its performance in areas where it is moderately competitive (that is, areas it ranks in the middle of the pack, but with potential to rapidly improve). Recent investments in the UK's health data, clinical trial and regulatory offers are crucial to realising this potential. Yet the window of opportunity will not last forever, as competitors are sharpening their offers to better compete in a more crowded market. Follow-through from the government is crucial to establishing new competitive advantages for the UK.

UK competitiveness at a glance
Business investment in pharmaceutical R&D
(£ billion)1
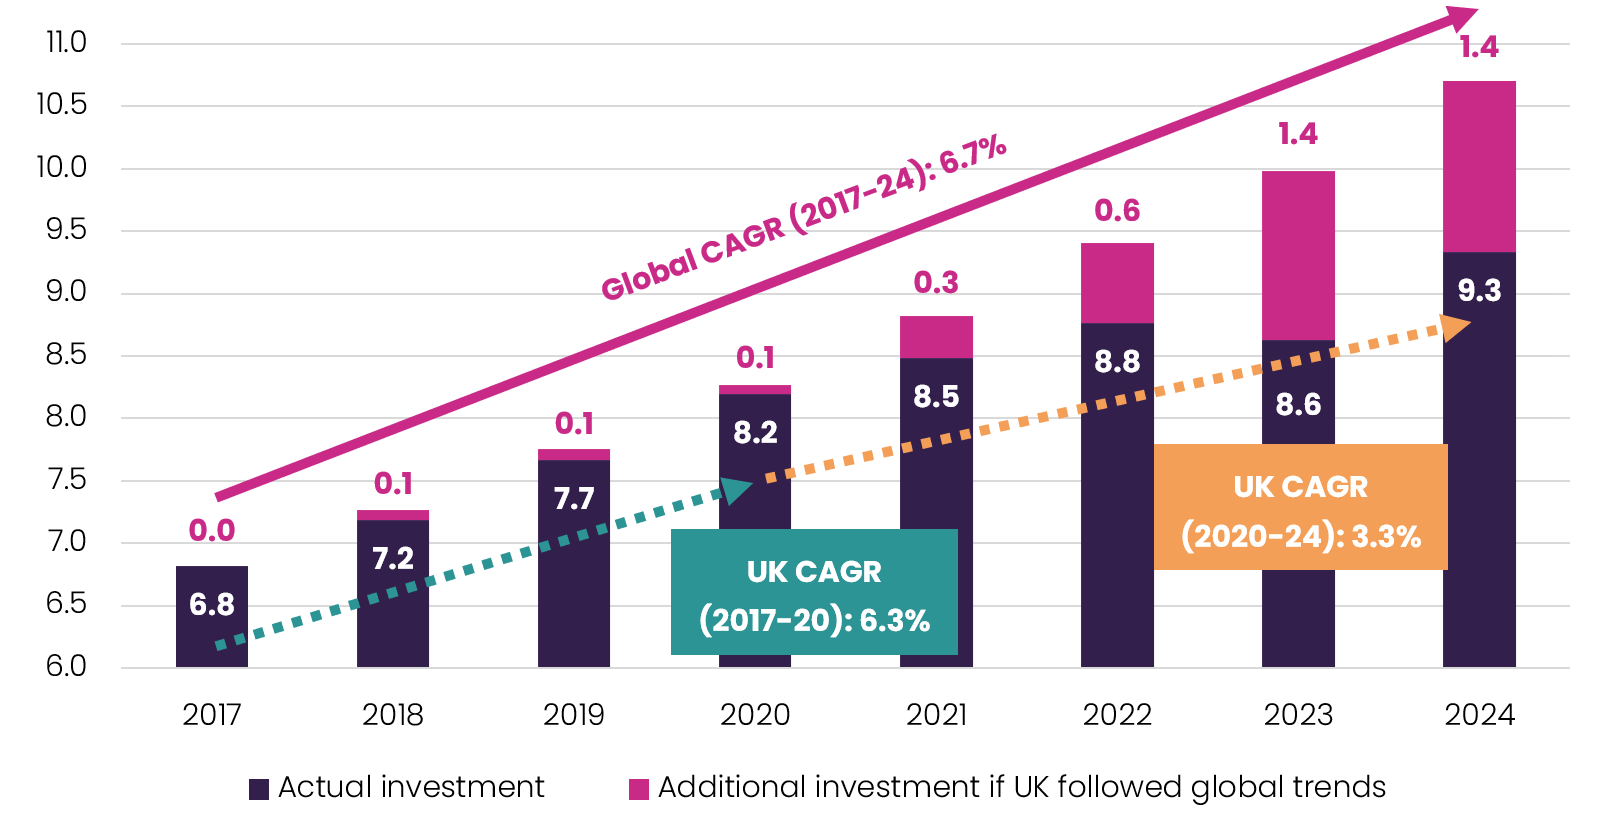
While business investment in pharmaceutical R&D grew to £9.3 billion in 2024, the UK’s growth rate still lags global trends. Since 2020, the estimated opportunity cost of this slower growth is worth approximately £3.8 billion of foregone investment.
Inward pharmaceutical foreign direct investment
(£ million)2
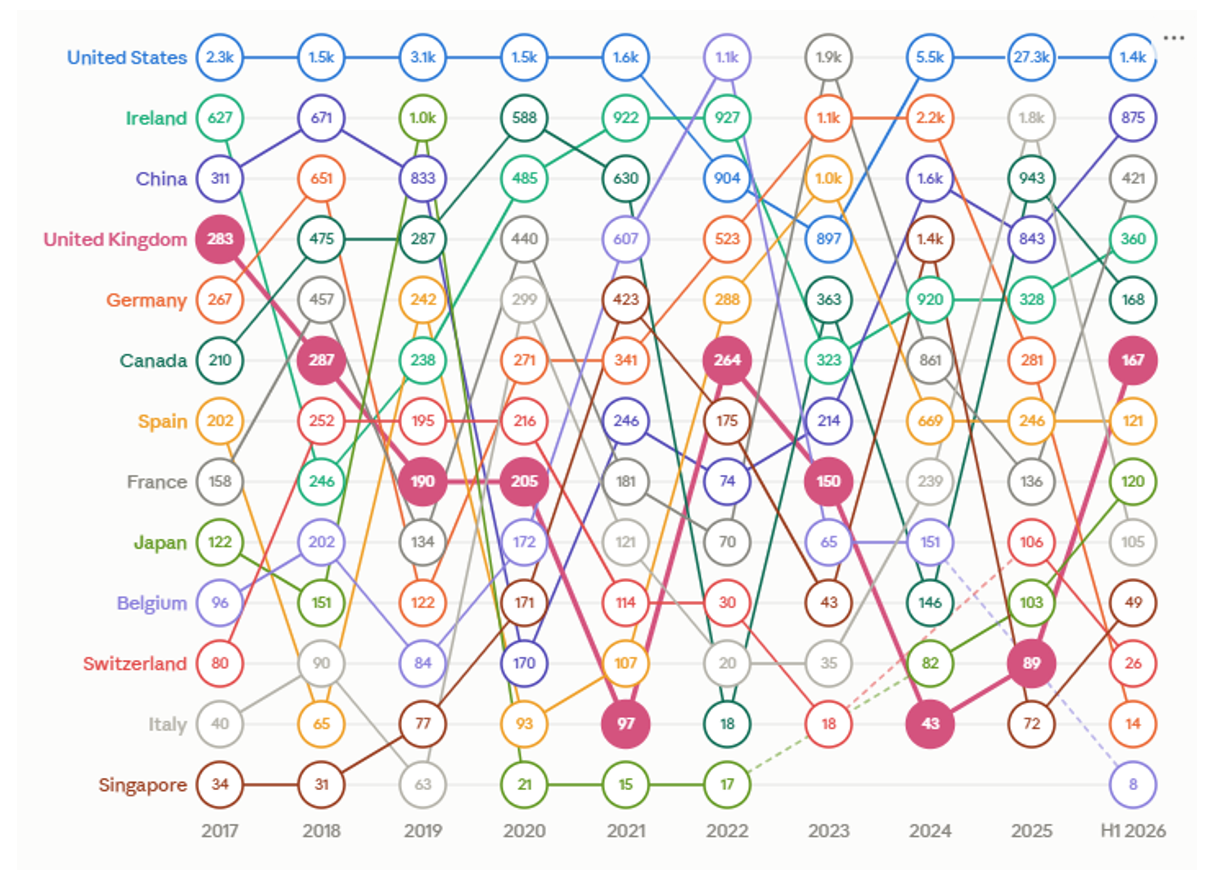
The UK attracted more pharmaceutical foreign direct investment (FDI) in the first half of 2026 (£167.2 million) than it did in all of 2025 (£88.8 million). Furthermore, this figure understates investment growth, as it excludes announcements made by companies headquartered in the UK, which account for significant and sustained investment.
Inward life sciences foreign direct investment
(£ million)3
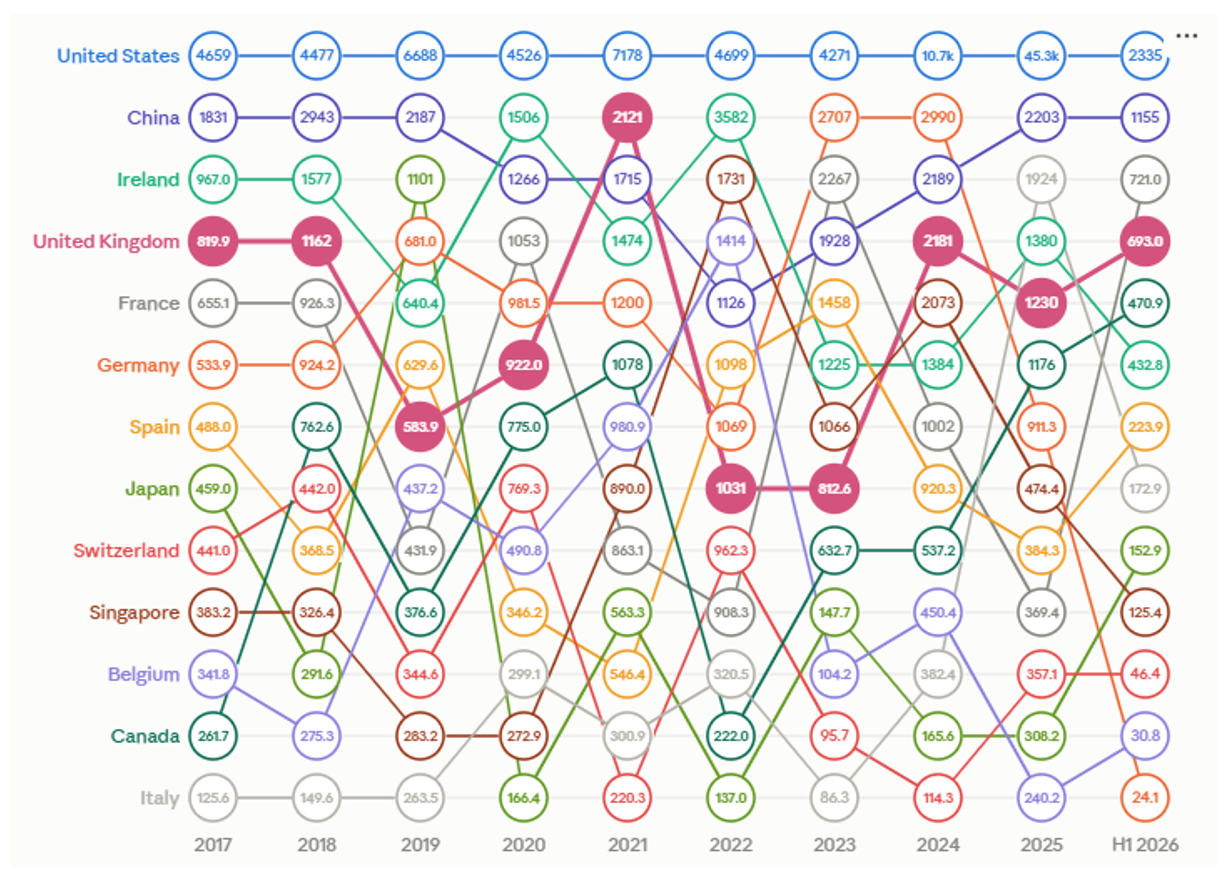
The UK attracted £693 million of FDI across the entire life sciences sector (of which the pharmaceutical sector is a subset) in the first half of 2026, keeping pace with 2025 levels. Much of this investment went to service and supply activities where demand is driven by pharmaceutical companies’ UK activity, and this performance is reflective of the overall strength of the ecosystem.
•Data only captures FDI announced in the first six months of 2026.
UK competitiveness in key investment drivers
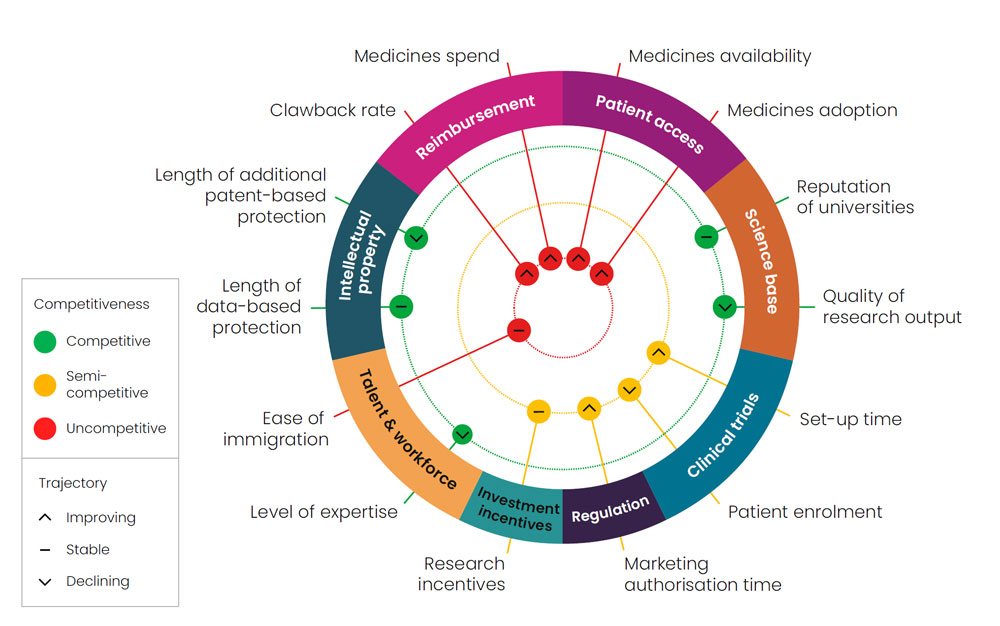
To measure global competitiveness, the report compares the UK’s performance with 12 leading pharmaceutical markets. The UK is rated green where it is globally leading, red where it lags the comparators, and amber where the UK is moderately competitive.
To measure trajectory, the report compares the UK’s current performance with its past performance in the previous edition. Arrow symbols indicate where the UK is improving or declining, while a hyphen indicates stable performance. This new measure was added to acknowledge where progress has been delivered but is not yet reflected in international metrics of global competitiveness, such as new policy commitments.
Introduction
How are investment decisions made?
For global pharmaceutical companies, deciding where to invest is a complex process. Investors must consider a broad mix of factors, from scientific capabilities and fiscal incentives to regulatory performance and access and adoption conditions. The weight of each factor will vary depending on the nature of the investment, with investors generally categorising factors as either:
◆ Essential baseline requirements: Prerequisite criteria that a country must meet before a company considers it a candidate destination to invest in (for example, robust intellectual property (IP) protections and access to scientific talent).
◆ Differentiators: Factors that can tip an investment decision in or out of a country's favour when multiple countries meet the baseline requirements (for example, a more favourable incentives regime or better data and (AI) capabilities).
The size of a country's pharmaceutical market and its future growth potential are notably impactful factors. Governments are increasingly competing for investment from a sector seen as central to achieving higher rates of productivity growth and greater economic and health resilience. To do so they are harnessing a broad set of policy and market levers to improve their attractiveness to global investors.
Why have we produced this report?
Nearly every government since the turn of the century has published a strategy to grow the UK's life sciences sector and inward investment from the pharmaceutical industry, recognising its strategic importance to the health and wealth of the nation. Although these successive strategies did achieve incremental successes, none fully achieved their goals. A persistent reason for this shortfall was the lack of a shared understanding between government and industry of which factors most influence investment decisions and the policies needed to improve the UK's global competitiveness.
This report aims to address that shortfall by benchmarking the UK's attractiveness as a destination for globally mobile investment against 12 leading pharmaceutical markets. To do so, it uses more than 40 internationally comparable metrics to robustly analyse where the UK is globally leading, where it lags behind, and where it can build new competitive advantages. The report is designed to be a diagnostic tool that both the government and industry can use to prioritise policies that will yield the greatest increase in inward investment.4
Has progress been made since the 2025 edition?
The 2025 edition of this report identified numerous competitive weaknesses that were undermining the UK's strengths and causing global investors to rule out the UK.5 The government has since made several commitments aimed at resolving, or beginning to address, these challenges and enhancing the UK's competitiveness. These include its Arrangement with the U.S. government on pharmaceutical pricing.
A consistent and credible plan for long-term delivery of these commitments is a crucial next step in strengthening investor confidence in the UK. Already there are early signs that the government’s efforts are yielding results for the economy and for patients:
◆ Since September 2025, the global pharmaceutical industry has committed £2 billion of investment into the UK, stretching across the value chain from AI-enabled discovery science to large-scale medicines manufacturing.7
◆ In the first three months after the National Institute for Health and Care Excellence (NICE) cost-effectiveness threshold was increased in April 2026, nine additional medicines were approved for use in the NHS.8

£2bn
global pharmaceutical industry investment in the UK
Long-term barriers to investment | UK government's response |
High repayment rates on pharmaceutical revenues that unpredictably rose to a minimum of 22.9 per cent in 2025, more than triple the average rate in the EU4. | Capped the newer medicines clawback rate at 15 per cent and conducted a 10-week 'sprint' review of the commercial environment with industry. |
Restricted availability of innovative medicines, with only 37 per cent of new medicines made fully available in the UK, compared with 90 per cent in Germany. | Raised the NICE cost-effectiveness threshold to £25,000–35,000 per quality-adjusted life year (QALY) in April 2026, the first increase since it was introduced in the early 2000s. |
Persistent underinvestment in medicines, comprising just 9 per cent of the UK's healthcare spending, below the 15 per cent average for developed economies. | Committed to double the UK's investment in innovative medicines to 0.6 per cent of GDP over the next decade, ensuring UK exports to the U.S. face 0 per cent tariffs for the next three years. |
Slow, inconsistent study set-up timelines for industry clinical trials, limiting patients' opportunities to participate in research. | Made major improvements to regulatory approval times for clinical trials, with nearly all applications assessed within 60 days,6 enabling progress towards the ambition of study set-up within 150 days. |
How are geopolitics influencing investment?
As the UK starts to build momentum, it faces a more complex and competitive global market for pharmaceutical investment:
◆ Governments around the world are deploying ever more interventionist industrial strategies to secure investment and supply chains. This includes the use of tariffs on medicines, historically exempt from trade restrictions, to drive re-shoring of manufacturing. The U.S. (the world's largest pharmaceutical market) is in the process of introducing its 'Most Favored Nation' pricing policies, which are driving substantial changes in where and how the industry prioritises investment at a global level.
◆ Joint procurement exercises, through mechanisms like the EU Critical Medicines Act, and relaxed application and interpretation of state aid rules are increasingly challenging the status quo that has underpinned pharmaceutical trade and investment decision-making in recent decades.
◆ China has completed its transition from a large pharmaceutical market reliant on inward investment and 'fast follower' business models to a scientific powerhouse pushing the frontiers of life sciences research. This adds pressure on incumbents like the UK to differentiate their investor offers and identify clear unique selling points or areas of scientific leadership.
◆ New participants in the global race for pharmaceutical investment continue to emerge. Markets in the Arabian Peninsula and Latin America, such as Saudi Arabia and Brazil, are growing particularly rapidly9 while improving their investor offers across the value chain. In time, these competitors will compound the challenge epitomised by China's growth but may also present opportunities if the UK acts quickly and decisively.
The government and industry must therefore continue working together to navigate these developments, improve the UK's global competitiveness, retain and attract more investment, and ultimately deliver the full ambitions of the Life Sciences Sector Plan.10
This annual report will continue to aid this work by using international performance metrics to benchmark the UK against its competitors. It should be used as a shared diagnostic tool to identify impactful and actionable policy interventions.
| ||
The U.S.-UK Pharmaceutical Arrangement, agreed in principle in December 2025, followed several months of independent discussions between government and the sector aimed at addressing the UK's most significant competitive weaknesses. As well as providing a vehicle through which to crystallise the commitments outlined in this report, the Arrangement provided an added benefit of insulating UK-based manufacturers from the risk of U.S. tariffs for the next three years. This provides UK investors17 with additional, much-needed stability, as well as a potential short- to medium-term competitive edge. |

| ||
After joining the international regulatory standards body11 and growing its regulatory workforce12 in the late 2010s, China has continued to rapidly enhance its performance – and its reputation among global boardrooms. For instance, since the 2025 edition was published, China's regulator (the National Medical Products Administration) has: ◆ Launched a 30-day approvals process for trials testing innovative medicines.13 ◆ Accelerated the process for importing medicines already marketed overseas.14 ◆ Enacted up-to-date, international standards for Good Clinical Practice.15 Robust data on China's regulatory timelines, versus its targets, remains difficult to source – hence its absence from the metrics in this report. That said, the National Medical Products Administration's performance is a key reason why China has shortened the total time it takes to bring new medicines to market. This factor alone accounts for approximately 40 per cent of the cost difference in medicines discovery and development between China and Western markets.16 Investors have clearly responded to this achievement, as China has increased the value of its licensed assets tenfold since 202117 and now outperforms the U.S. in volumes of both phase I and III industry clinical trials.18 |

Chapter 1
What are the UK's competitive strengths?
The UK has retained the competitive strengths identified in the 2025 edition of this report, including its science base, domestic talent, and protections for IP. Yet, several of these structural capabilities are at risk of being eroded and will take years to rebuild if the UK does not act proactively to enhance them in the face of growing competition.
Science base
The UK’s capabilities in pre-clinical research remain the strongest aspect of its investor offer. This competitive advantage relies on expertise and infrastructure that the UK must continue to strengthen so it can expand its global share of pre-clinical investment.
While the quality of UK research remains high, its rankings have fallen in two indicators:
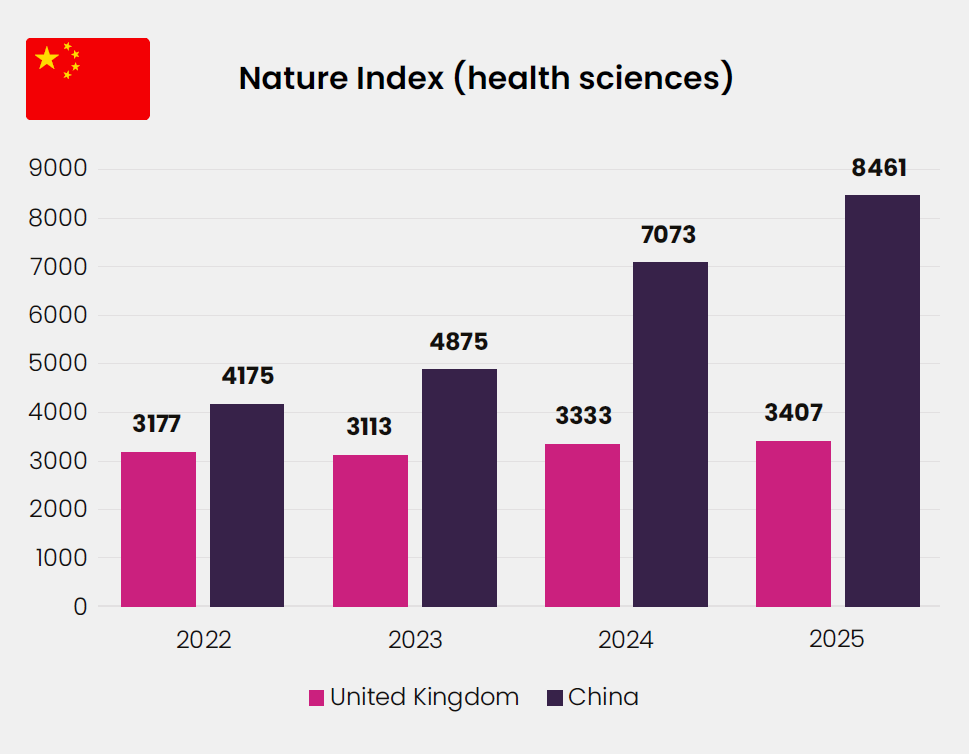
◆ The UK fell to 3rd in the Nature Index in 2025 due to changes in its methodology,19 which now ranks China as 2nd in every year of the Index. The data shows that China has rapidly extended its lead over the UK in terms of quality research output, in large part, due to sustained investment in research infrastructure.20
◆ The UK's global share of the top 1 per cent most cited medical publications fell to 1.8 per cent in 2024, placing it 2nd behind France. This outcome also reflects rising competition from outside Europe (mainly China), as the UK, France, Germany, and Italy all saw their global shares decline over the past decade. The performance gap between these four countries has narrowed, however, suggesting that competition within Europe has also intensified.21
The UK still ranks in the top three for 7 out of 9 metrics, more than any other investment area. The UK has 16 of the world's top 100 universities for life sciences, the largest government budget for health R&D in Europe, and an exceptionally strong research charity ecosystem.22 The UK also ranks first in Europe for number of biotechs and venture capital raised, demonstrating its prowess in early-stage research commercialisation.
However, the long-term trajectory of this data shows that the UK's competitors are closing the gap. This warrants government attention now because the competitiveness of the UK's science base relies on structural capabilities, such as research infrastructure and universities, that need sustained funding to build and maintain. Even China's biotech sector, which grew exceptionally quickly by historical standards, required well over a decade of investment in the country's educational, regulatory, and scientific systems.23 As such, the competitiveness of a country's science base is a lagging indicator of past investment decisions made by government (and industry), which means that early signs of falling performance should be acted on sooner rather than later.
To extend its advantage in a more crowded global market, the UK's science base should ensure sufficient resources are directed towards the development of novel capabilities that differentiate its offer against countries that outcompete the UK on cost and time to market.24 The government's investment of £20 million to create a Pre-clinical Translational Model Hub25 and £30 million to establish a UK Centre for the Validation of Alternative Methods26 is a prime example of this proactive approach at work. This infrastructure is well-suited to crowding in industry co-investment because it focuses research funding on solving a global challenge in medicines development.27
Domestic talent
A highly skilled workforce is a baseline requirement for investment due to the R&D-intensive nature of the sector, as 80 per cent of UK pharmaceutical job postings require a degree or higher.29 It is therefore concerning that the proportion of UK students graduating with a degree in natural sciences, mathematics, or statistics has fallen from 9.22 per cent in 2020 to 7.97 per cent in 2023, pushing the UK's rank down from 1st to 6th.
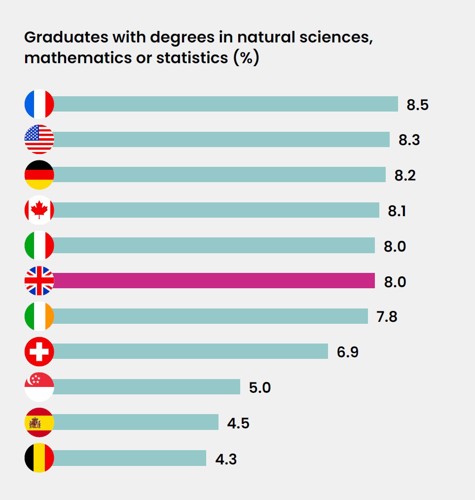
The UK's percentage is still close to that of the top five countries, and the decline is primarily driven by natural sciences growing at a slower pace than other subjects. However, the fall from 9.22 per cent ends a prolonged period where the UK outperformed its peers (by 1.04 and 0.57 percentage points in 2020 and 2021).
Since this data is time-lagged by three years, we cannot robustly estimate whether this downward trajectory has continued. However, the UK's training capacity has likely shrunk since 2022/23, with 11 universities closing their undergraduate chemistry courses due to financial pressures.30 This challenge is not isolated to chemistry, as the removal of Apprenticeship Levy funding for most postgraduate apprenticeships in January 202631 will reduce revenue for universities if it is not replaced by other sources of income.32 Like its science base, the UK's training capacity takes years to develop, so its shrinkage should be closely monitored as a potential mid to long-term risk to competitiveness.
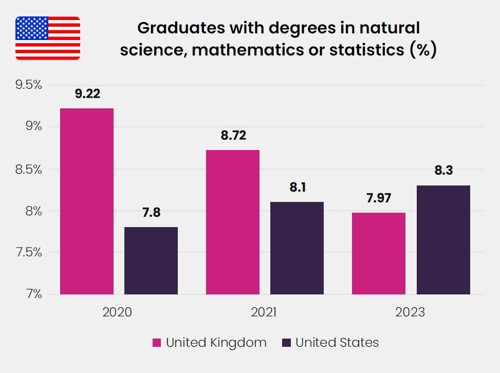
In contrast, U.S. output of natural sciences, mathematics, and statistics graduates has grown consistently between 2015 (7 per cent) and 2023 (8.3 per cent), adding a new edge to its investor offer.33 The causes of this trend are complex, but the primary driver is that demand for these graduates has increased due to elevated levels of job creation in STEM sectors, including the pharmaceutical industry, compared with non-STEM sectors (see appendix for details).34
The success of the U.S. illustrates how a competitive investment environment that supports job creation can generate a virtuous cycle, whereby rising demand for trained workers drives investment in high-quality education and training providers.
Explainer:
What is the UK's growth potential?
Recent analysis estimates the UK's pharmaceutical industry could create up to 81,300 new jobs by 2035 if growth accelerates.35 This would represent a 64 per cent increase in headcount, expanding the pharmaceutical workforce from 125,000 jobs today to 200,000 and creating employment opportunities across all corners of the UK. This growth would translate into £33.4 billion of direct Gross Value Added (GVA), up from £20.4 billion today.36
Intellectual property
From a policy perspective, both domestically and internationally, the UK has been a longstanding champion for robust and stable IP protections, which are a baseline requirement for industry investment. The UK's protections for IP remain globally competitive, providing ten years of Regulatory Data Protection (RDP)37 and five-year (maximum) Supplementary Protection Certificates (SPCs).38
Since the 2025 edition of this report, two developments have distinguished this competitive advantage:
◆ The UK and Switzerland concluded negotiations on a free trade agreement containing world-leading IP provisions that safeguard both countries' current frameworks while preserving their ability to extend domestic protection in the future.
◆ In contrast, new EU legislation will reduce pharmaceutical IP protections by shortening the overall RDP period by one year to a basic nine-year period. Additionally, market exclusivity in the EU will be removable in relevant local markets and data exclusivity eroded if new access or supply obligations are not met.
| 12–15yrs to develop a new medicine costing $1.2–1.7 billion |

Explainer:
Why do IP protections enable investment?
Developing a new medicine typically takes 12 to 15 years and costs between $1.2–1.7bn because of the high risk of failure,39 with less than 10 per cent of candidates passing every phase of clinical development and being approved.40 To justify this investment, innovators need complete confidence that successful medicines and vaccines will have a reliable period of IP protection, allowing innovators to recoup their investment and fund the next generation of research. Consequently, strong and reliable IP protections are an essential baseline requirement for investment.
The UK’s commitment to maintain its IP protections, while competitor countries in the EU reduce theirs, provides the UK with a strategic opportunity to distinguish itself as a stable and innovation-friendly destination for investment. However, while the UK’s policy trajectory for IP protections is globally competitive, these efforts are undermined by growing concerns about the reliability of UK patent protection for pharmaceuticals.
Explainer:
Why is this strength at risk?
Our metrics for IP protection do not capture an alarming trend in how the UK enforces patent protection, which could turn this longstanding competitive strength into a risk.
In recent years, UK courts have invalidated several patents using the 'doctrine of plausibility',41 resulting in the early loss of exclusivity for those medicines. Crucially, these decisions have diverged from European courts' use of the plausibility doctrine, despite both sharing similar underpinning legislation, leading to patents and related SPCs being revoked in the UK while equivalent rights have been upheld internationally. As a result, innovators face greater uncertainty around the length of patent protection in the UK, undermining the competitiveness of its IP protections.42
Chapter 2
Addressing the UK's key competitive weaknesses
The UK is making progress to address several critical weaknesses that undermine the UK's competitive strengths and have deterred investment. These include persistently narrow access to, slow adoption of, and underinvestment in innovative medicines and vaccines, as well as high and unpredictable clawback rates on pharmaceutical revenues. Since the 2025 edition of this report was published, significant policy commitments have been made to resolve or begin to address these challenges.
Following these commitments, there are early signs that investor sentiment is improving. Sustained delivery against these commitments and a continued focus on ensuring NHS patients can access new medicines are essential if the UK is to translate improved sentiment into tangible investment.
Medicines availability and adoption
The UK has persistently been a challenging market for making new, innovative medicines available to patients, and a cost containment culture has hampered adoption within the NHS:
◆ The UK ranks 5th out of eight European comparator countries for medicines availability, with just 33 per cent of new medicines made fully available for their licensed use in 2021–24.43 This is a decrease from 37 per cent in 2020–23, where the UK also ranked 5th.
◆ The UK ranked 5th out of five European comparators in 2023, 2024, and 2025 for medicines adoption, according to a new metric of how different countries' health systems adopt the same cohort of new medicines (see methodology).
Increasing the availability and adoption of innovative medicines across the NHS is pivotal to improving patient care and health outcomes. Crucially for the UK's growth prospects, it is also vital to bolstering the UK's ability to attract and retain globally mobile investment.
| 4percentage points decrease of medicines made fully available |

| 5th of five European comparators for medicines adoption |

Explainer:
Why does medicines availability and adoption matter for investment?
The ability to launch new medicines and vaccines, as well as ensure widespread adoption of clinically and cost-effective innovations, has a major influence over all forms of industry investment. Sometimes this is direct, where adoption of a medicine enables or undermines the business case for investing; or indirect, improving or damaging sentiment towards a market.
◆ To generate robust and representative evidence, industry clinical trials recruit patients globally and, as such, use global standards of care as a comparator. Countries that do not adopt innovative medicines will be less able to meet this standard and, in turn, less viable hosts for investment.
For example, placing a clinical trial in a country that is less likely to adopt newly approved medicines carries the risk that patients on that trial will not have a path to continuity of care if the trial concludes successfully. This creates ethical and commercial challenges for the company. Given this risk can be avoided by locating the trial elsewhere, a country failing to meet global standards of care creates a strong deterrent against inward investment.
◆ A country's pharmaceutical market is decisive in how much companies invest in commercial and regulatory functions, such as medical affairs, that bring with them well-paid jobs. If a market becomes less commercially viable, that country risks losing these affiliate-level jobs to more competitive markets. A shrinking affiliate also sends a negative signal to global boardrooms, reducing that country's standing in future decisions on where to allocate investment.
◆ Certain medicines, such as radiopharmaceuticals with short shelf lives and personalised treatments, must be produced nearer patients compared with other medicines; as a result, it is harder to export these medicines over long distances. This difficulty increases the importance of local market conditions when investors decide which countries should host the manufacturing sites for these medicines. Specifically, investors are more reliant on local sales to justify the investment because they are less able to use long-distance exports to more competitive markets as a means of offsetting the host country's uncompetitive market.
Progress made so far
Since the 2025 edition of this report was published, the UK has made some positive policy commitments that lay the groundwork for addressing these barriers to investment. The NICE threshold used to assess the cost-effectiveness of medicines has been raised for the first time since its introduction in the early 2000s. At the same time, the government has committed to double the UK's investment in innovative medicines to 0.6 per cent of Gross Domestic Product (GDP) over the next decade.
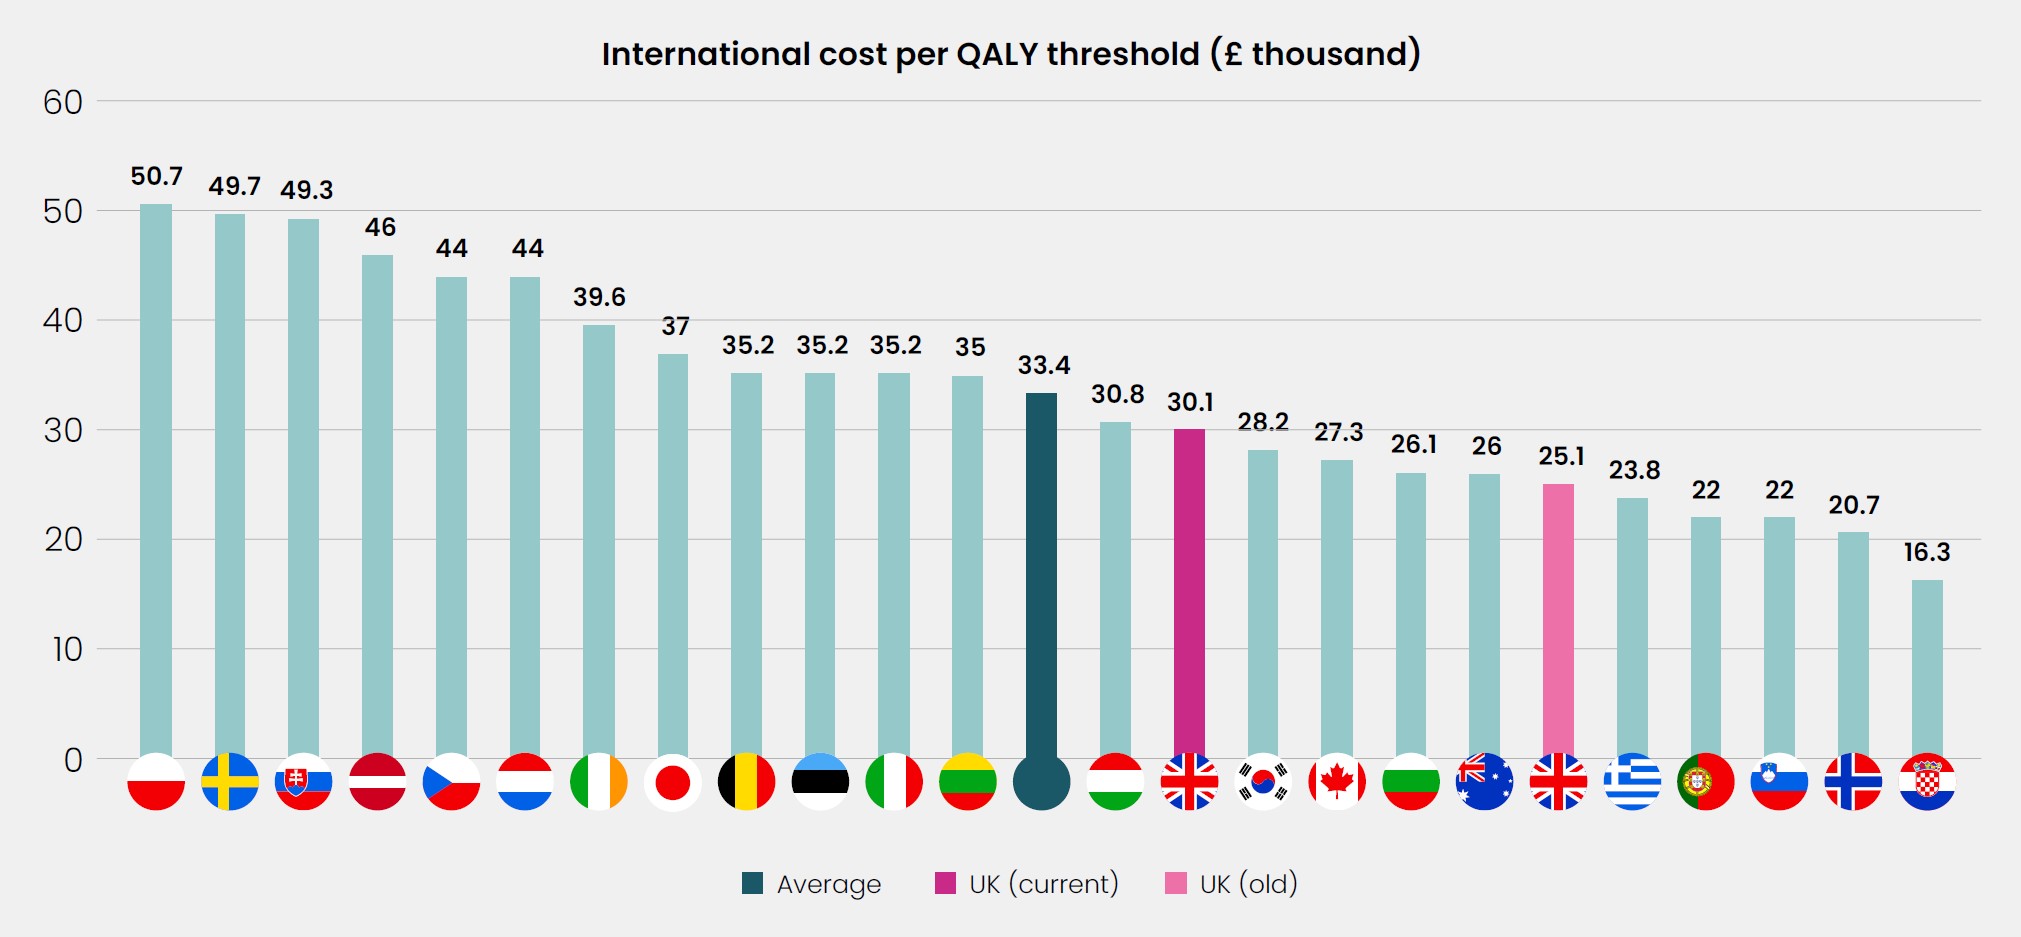
Increasing NICE's threshold to £25,000–35,000 per QALY has brought the UK closer to the international average of developed economies that use fixed cost-effectiveness thresholds in terms of how medicines are valued.44 As a result of this change, nine additional medicines were approved for use in England and Wales between April and June 2026, which would have been denied to patients if the threshold had not been raised.45 Additionally, this updated threshold has been recognised by the Scottish Medicines Consortium, though it does not use a fixed threshold.
The outputs of the recent 'sprint' review of the commercial environment include four pilots to test proof-of-concept approaches that will inform future policy direction. These pilots provide an opportunity to continue making progress towards creating an innovation-ready NHS that improves the speed and scale of its adoption of new medicines and healthcare technologies.
These changes are sending positive signals. To maintain this momentum and investor confidence, focus must now turn to implementation, ensuring the UK's availability and adoption environment evolves in a way that enables delivery of the 0.6 per cent GDP spend target and the rapid, consistent adoption of innovation.
Clawback rates
Alongside medicines availability and adoption, the UK's system of pharmaceutical revenue clawbacks has been a major negative outlier in recent years. In 2025, it peaked at a minimum rate of 22.9 per cent for newer medicines, up from 15.1 per cent in 2024.46
| In 2025, the newer medicines rate peaked at 22.9% |

The scale of this increase was far above the 15.9 per cent forecast and, consequently, had a severe effect on investor sentiment towards the UK. Many companies viewed clawbacks in the UK as a contagion risk that, if adopted elsewhere, would render the global operating model, which enables industry investment and innovation, unviable. Consequently, the UK was increasingly ruled out as a place to invest, with several large-scale investments being pulled or paused in 2025.
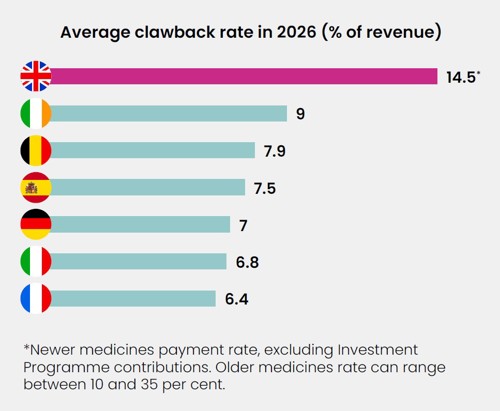
To respond to this competitive weakness, which undercut the strengths of the UK's investor offer, the government has capped the clawback rate for newer medicines at 15 per cent. This move coincided with the newer medicines rate falling to 14.5 per cent in 2026. However, the UK's clawback rate remains much higher than every other comparator country in this analysis, with several not operating a clawback system at all.
| Newer medicines rate in 2026 fell to 14.5% |

The next step for the government and industry is to agree a new, more sustainable scheme model from 2029 onwards. Ensuring that this future model offers stability, predictability, and is internationally competitive relative to other markets will be a critical milestone for rebuilding long-term investor confidence.
Explainer:
Addressing the UK's long-term underinvestment in innovative medicines
The government's commitment to double the UK's investment in innovative medicines to at least 0.6 per cent of GDP is a step-change from two decades of policies that have undervalued innovation and driven real-term disinvestment in medicines. This long-term disinvestment has been a major driver of the negative sentiment towards the UK that accumulated among global investors and peaked in recent years.
The government's 0.6 per cent target for innovative medicines includes interim milestones for 2028 (0.35 per cent) and 2030 (0.4 per cent). Delivering on this goal – which should return the UK to a globally competitive position – will require a mix of commitments that broaden patient access, drive consistent and timely adoption, and reduce or eliminate industry clawback payments.
Global talent
International workforces underpin modern pharmaceutical innovation, manufacturing, and supply chains. While the UK industry invests heavily in local training,47 global talent continues to provide vital expertise and experience, complementing domestic talent and helping to fill skills gaps that would otherwise inhibit growth and investment.
Countries with policies that deter the world's top talent therefore put themselves at a disadvantage when competing for investment. In this context, the UK is exceptionally uncompetitive, with the cost of a Skilled Worker visa rising by 4.3 per cent in 2025 to more than £12,000 per person, far above the cost of similar visas offered by competitors.
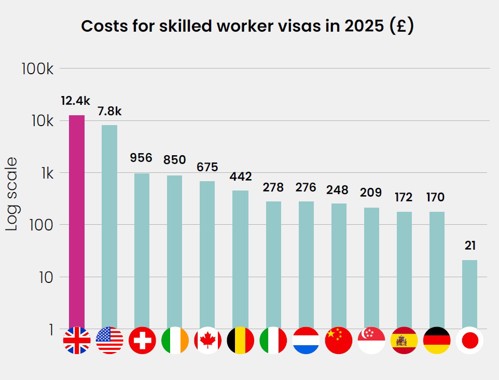
The government has recently committed to attract more of the world's top life sciences talent, in recognition of their invaluable contribution to growth.48 This plan is welcome, and the decision to expand access to the Global Talent visa to a pilot of ABPI members and other R&D-intensive businesses is a positive step towards realising this ambition.49 However, these efforts risk being undermined if the timelines for global talent and their dependents to attain permanent settlement are decoupled by up to seven years.50
| ||
◆ UK efforts lag Germany's, which has created a new visa to lure qualified, non-EU citizens to its workforce.51 In its first year, more than 11,000 of these visas were granted.52 ◆ A £54 million UK scheme to attract top researchers53 risks being overshadowed by the 'Choose Europe for Science' strategy, as the European Commission nearly doubled its budget to €900 million in January 2026.54 |

Chapter 3
Opportunities to enhance the UK's offer
The UK can become more attractive to inward investment by improving its performance in areas where it currently sits in the middle of the pack. Over the past year, the UK has invested in unlocking the utility of its health data, expanding its capacity for industry clinical trials, and enhancing its regulatory performance.
However, the UK's window of opportunity will not last forever, as its competitors are acting decisively to better compete in a more crowded global market. Sustained follow-through from the government is therefore crucial to translating these policy commitments into new competitive advantages that will differentiate the UK's offer.
Regulation
The predictability, reliability, and speed of national regulatory processes55 are key determinants of where companies undertake pre-clinical and clinical research, manufacture medicines and vaccines, launch products, and locate their commercial hubs. In addition to improving their performance, regulatory agencies can boost global competitiveness by linking their processes with those of other trusted authorities (for example, through international reliance or work-sharing procedures). In effect, such partnerships connect a country's pharmaceutical market with other markets to establish a larger, more attractive market.
Encouragingly, the UK's regulatory offer has become more competitive over the past year due, in large part, to improved performance from the Medicines and Healthcare products Regulatory Agency (MHRA):
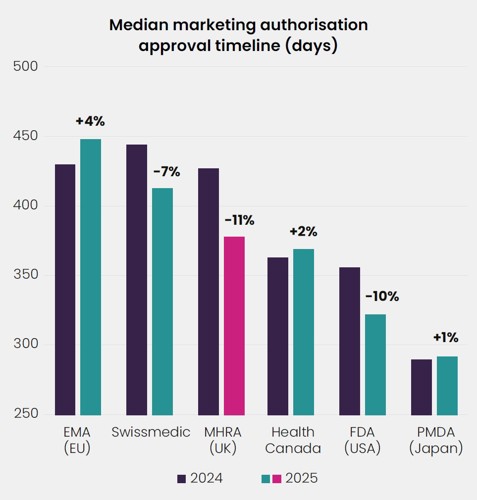
◆ Median time to approve a new medicine fell from 427 days in 2024 to 378 days in 2025. As a result, the UK ranks 4th out of six agencies featured in this analysis, narrowly behind Canada.
◆ Nearly every (98 per cent) clinical trial application in the UK receives regulatory approval within 60 days (or 90 days for advanced therapy studies).56 The enactment of updated legislation should help to further streamline approvals.57
This represents meaningful progress and has been accompanied by efforts to increase the reliability and predictability of other regulatory procedures, including the provision of scientific advice. This has been exemplified by the work undertaken to further align MHRA and NICE procedures to streamline decisions on licensing and value for medicines58 and the Centres of Excellence for Regulatory Science and Innovation's work to foster collaboration between academia, industry and regulators to help accelerate the delivery of safe innovation.59 Maintaining this trajectory is crucial to honing a new competitive edge in the UK's offer amid rising pressure from both established and emerging regulatory agencies around the world.
Clinical trial delivery
Clinical research is the most time-intensive and costly part of the pharmaceutical R&D process60 and one of the most globally mobile forms of industry investment. The evidence generated by clinical trials determines whether new medicines and vaccines advance to the next phase of development and, ultimately, whether they receive regulatory approval. Consequently, investors place considerable weight on a country's ability to efficiently set up and deliver clinical trials to time and target.
The UK's performance in delivering industry clinical trials has received significant attention from the government, devolved administrations, and arms-length bodies like the MHRA in the years following the O'Shaughnessy Review.61
Over the past 18 months, this attention has been translated into significant policy commitments that seek to restore the UK's global competitiveness in clinical research, including:
◆ A commitment to accelerate the set-up of interventional industry clinical trials to within 150 days by March 2026.
◆ The establishment of 35 Commercial Clinical Research Delivery Centres (CRDCs), creating dedicated capacity for industry clinical trials across both primary and secondary care (supported by approximately £300 million of industry funding).
◆ UK-wide enhancements to how industry clinical trials are costed and contracted to increase efficiencies in trial set-up.
Available performance data, which is published monthly by the UK Clinical Research Delivery programme, paints a mixed picture with positive progress in some areas, and stagnant progress in others.
Explainer:
What do international clinical trial metrics show?
International metrics show the UK's median timeline for setting up industry clinical trials increased to 338 days in 2023 and its rank for patient recruitment fell to 5th out of eight comparator countries.62 While this data has been historically useful, its time-lag makes it a suboptimal metric of global competitiveness. For instance, we know 2023 experienced a large backlog of regulatory approvals, which the MHRA has since resolved.63 This data is included in the report's dashboard of metrics for consistency but should be read with care, as it is not directly comparable to the UK-only performance data analysed below.
Study set-up
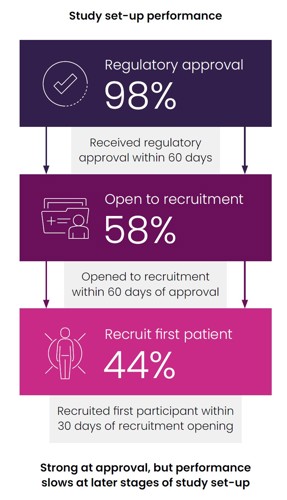
In April 2026, 98 per cent of clinical trials received regulatory approval within the target timeframe of 60 days.64 This level of performance – which involves both regulatory and ethics approval from the MHRA, Health Research Authority, and equivalent devolved nation bodies – is a major improvement following a period of challenge that will accelerate the overall set-up process.
However, less progress has been made on the latter stages of set-up. The latest data (December 2025) shows that only 58 per cent of industry trials opened to recruitment within 60 days of receiving approval, while just 44 per cent of industry trials recruited their first participant within 30 days of recruitment beginning.65 While these values are higher than those observed in 2023 and 2024, both are below the 90 per cent target. This represents progress, but is not yet at the speed and consistency needed.
Patient enrolment
Recruitment to interventional industry clinical trials in the UK has continued to decline, dropping by 25 per cent between 2022/23 and 2024/25.66 Furthermore, companies report that the UK often recruits fewer patients per site compared with other leading European trial destinations.
Unreliable recruitment to industry trials limits opportunities for patients to participate in research, the NHS to generate revenue it can reinvest in its workforce and infrastructure, and researchers to accelerate the transition of innovations from bench to bedside. Consequently, the UK is less attractive to those deciding where to locate industry trials. This is a reminder of why focus on speed of set-up alone is only part of the picture, with attention required on full end-to-end trial delivery if the UK is to capitalise on the current, more positive investor sentiment.
Explainer:
How do the new Commercial Research Delivery Centres perform?
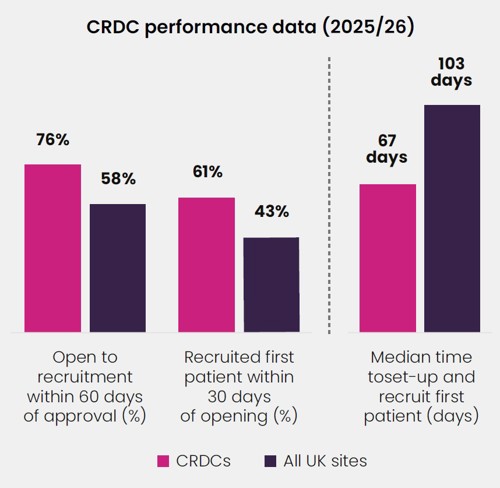
While there is variability between sites, the UK network of CRDCs is outperforming the wider health system in study set-up.67
The ambition to set up clinical trials within 150 days is welcome. While some sites and industry trials are outperforming this target, further improvements are needed if all trials and sites are to consistently achieve it. Doing so has only become more important and urgent in the past year, as both the EU68 and U.S.69 are implementing substantial reforms to accelerate study set-up processes and win a greater share of industry investment.
| £7.2 billion GVA generated per year by industry clinical trials, supporting 65,000 UK jobs70 |

| £3 billion additional GVA per year and 26,000 new jobs by restoring trial activity to 2017 levels71 |

Health data
The availability and quality of health data continue to have a growing influence on decisions made by global companies across the pharmaceutical value chain:
◆ Pre-clinical research: Clinical samples, such as blood and tissue collected from patients or research participants, are critical enablers of discovery science that must be undertaken before new medicines and vaccines enter clinical trials. Countries that can offer industry accessible, high-quality samples are therefore at a significant advantage in the global competition for pre-clinical investment. While the UK boasts world-renowned collections of clinical samples, it is limited by a lack of discoverability, inconsistent approaches to collecting, storing and accessing samples, and limited standardisation of data governance models. An upcoming ABPI report will analyse these challenges in detail and recommend policy responses.
◆ Clinical research: Access to high-quality health data increases a country's attractiveness to investment in clinical trials because it enables more efficient study set-up and delivery. For example, data on a location's population enables researchers to assess the feasibility of a clinical trial, while patient records can facilitate efficient and representative recruitment of research participants. However, the UK's offering falls short due to unreliable feasibility assessments of study sites, inaccurate screening of potential participants, and fragmented approaches to using NHS data.72 These limitations prevent the expansion of trial participation envisioned in the O'Shaughnessy Review.73
◆ Headquarters and affiliates: Data generated in routine clinical practice is increasingly used to provide real-world evidence (RWE) to support regulatory submissions, health technology assessment, and managed access agreements. Countries that enable efficient RWE generation and access will therefore be better positioned to attract investment across a medicine's lifecycle, rather than just its research and development. However, the UK's RWE offering is held back by fragmented access routes across the four nations, protracted and inconsistent approvals, unresolved commercial access terms, and a Secure Data Environment network that remains immature and unevenly implemented.74
If industry could more readily access the high-quality and representative longitudinal health data recorded by the NHS and other datasets, through safe and secure mechanisms, the UK would possess a unique selling point that could help it to attract additional investment. The Health Data Research Service (HDRS), which has received a £600 million investment from the government and Wellcome to transform the UK's health data assets into a coherent national service, will be crucial to realising this goal. The HDRS now has a strong leadership team in place and a clear strategic vision, which the government must follow through on to overcome the barriers that have hindered past efforts to maximise the competitive advantage of UK health data.
Tax and investment incentives
A country's tax and incentives offer acts as both a foundation of its viability as a destination for pharmaceutical investment and as a differentiator that countries can use to distinguish themselves from other markets and become more competitive:
◆ A stable, competitive tax environment is crucial for long-lasting capital projects, such as manufacturing and R&D sites, with high upfront costs that incentives can partially offset, making a country more attractive to global investors.
◆ These policy levers are similarly impactful when companies decide where to base business activities that have long investment cycles, such as pre-clinical and clinical research, but which are more internationally mobile than capital projects.
The UK's offer currently ranks as moderately competitive. However, this position is fluid and dependent upon critical investment incentives, such as the Patent Box and R&D Expenditure Credit (RDEC). For example, the UK's Patent Box was one of the world's first, acting as a unique selling point that differentiated its investor offer; today, it is a foundational requirement for attracting pharmaceutical investment, with 13 of 27 EU Member States and 19 out of 37 OECD countries having a Patent Box as of mid-2024.75 This offer could either become globally leading or fall behind depending on how the UK responds to competitor markets' recent efforts to boost their global competitiveness.
Tax incentives
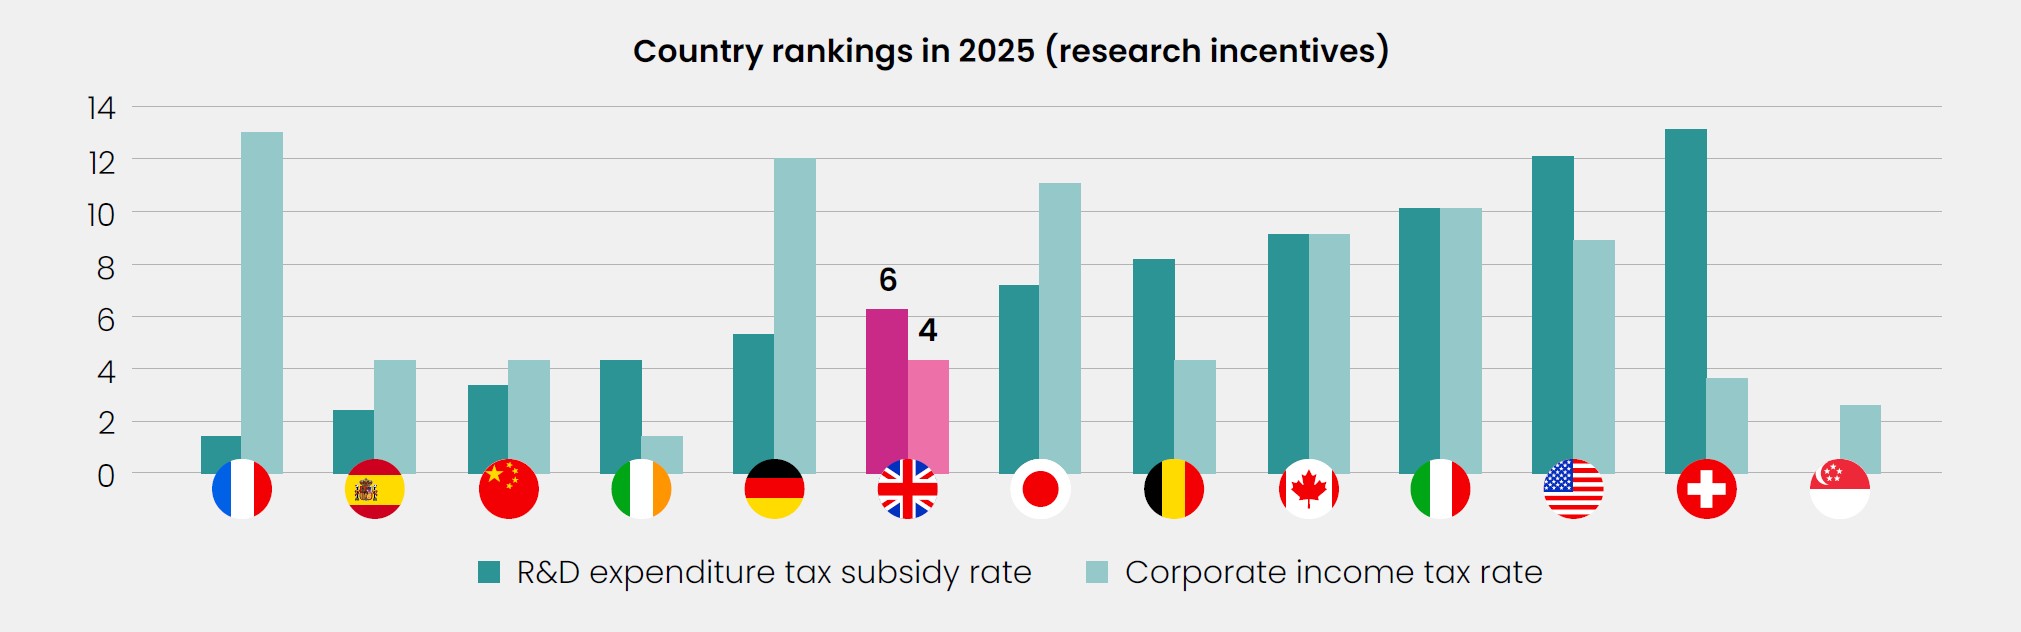
The UK still ranks 6th out of 12 comparator countries for the competitiveness of its R&D incentives. However, since the metric is calculated using a country's rate of corporation tax,76 R&D incentives and tax must be compared to provide an accurate benchmark:
This approach shows the UK remains reasonably competitive, with its corporation tax rate ranking joint 4th alongside China, Spain, and Belgium. It also suggests that the competitiveness of France's R&D tax credit system, which is capped at €100 million per year,77 is inflated by its high tax rate, which ranks 13th out of 13. Conversely, Ireland's offer features both an attractive R&D incentive and a world-leading tax environment.
The ABPI welcomes the government's commitment to maintain the current rates and structure of its tax and financial incentives offer, as reducing them would significantly reduce the UK's attractiveness as a destination for pharmaceutical investment.78
These incentives also provide excellent value for taxpayers' money, as every £1 of R&D tax credits generates £2.4–2.7 of additional private investment,79 while the Patent Box adds between £2.2–3.7 billion of GVA to the UK's economic growth each year.80 However, maintaining the UK's offer may prove insufficient. Competitor countries are quickly improving their incentives to more effectively compete for investment, with the UK's RDEC (which provides a 20 per cent rate of relief) under pressure from:
◆ Ireland, which in January 2026 raised its R&D tax credit rate from 30 to 35 per cent,81 improving an already competitive incentive that, unlike the UK's, includes capital expenditure and construction costs.82
◆ Japan, which in March 2026 established a new R&D tax credit for strategic technologies, including pharmaceuticals, offering a minimum relief rate of 40 per cent.83
Capital grants
Over the past year, the UK has broadened its capital grant offer:
◆ The Life Sciences Innovative Manufacturing Fund (LSIMF) is building on the success of its predecessors.84 To date, it has deployed £87 million of grants to secure £657 million of private investment and support more than 1,200 jobs.85
◆ The LSIMF's efficacy is expected to improve due to the Office for Life Sciences' efforts to refine its implementation. For example, the time horizon used to assess the employment benefits of manufacturing sites has been doubled to up to 20 years, in recognition of their resilience to economic cycles.86
◆ Accompanying the LSIMF is the Life Sciences Large Investment Portfolio, which seeks to secure investments worth more than £250 million by offering an expedited grants process, and the Life Sciences Transformational R&D Investment Fund.
The UK can now deploy up to £570 million of capital grants over a five-year period, helping it better compete for capital investments that will create economic opportunities across the country and increase its health resilience.87 Yet, countries around the world continue to bend and reshape international rules governing state aid to attract increasingly contested investment in strategic sectors like the pharmaceutical industry. Ongoing benchmarking of the UK's capital grants offer therefore remains crucial to achieving the Sector Plan's target for investment.
Data and methodology
How the report benchmarks the UK
For global pharmaceutical companies, deciding where to invest is a complex process. Investors weigh up a broad mix of factors, from scientific capabilities and fiscal incentives to regulatory performance and access and uptake conditions.
The weight of each factor will vary depending on the nature of the investment. Some factors only influence specific forms of investment while other factors broadly affect investment decision-making across the value chain.
This report uses a three-step approach to transform complex investment criteria into a comparable, quantitative scorecard. This methodology enables an 'at a glance' assessment of the UK's competitiveness as an investment location, which is intended to help government and industry prioritise policies that will yield the greatest increase in inward investment.
| ||
| ||
|

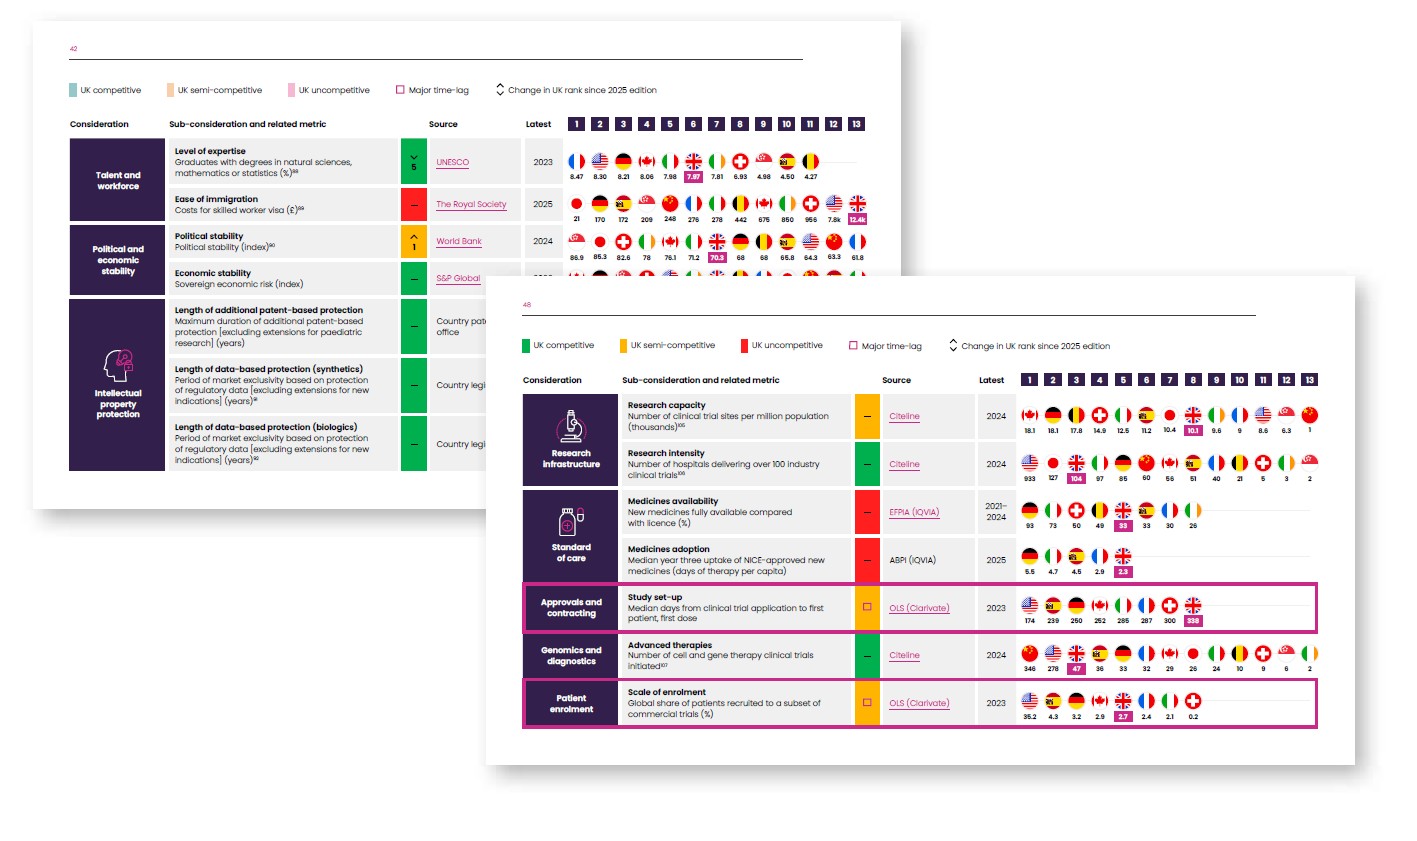
Country rankings in these metrics may not always present a full view of performance in various investment considerations. For example, some considerations feature inherent complexity that statistics alone cannot convey (for example, IP protections), while others may feature data so time-lagged that it does not reflect the real-time data that investors have access to when making decisions (for example, study set-up).
To account for these characteristics, the report uses a red-ambergreen rating to represent the UK’s performance relative to the comparator countries. For instance, the UK is rated green (competitive) where it outperforms comparable economies, or it is in line with the highest international standards, in an investor consideration. Ratings of the UK’s global competitiveness are informed by up-to-date insights from ABPI members, especially where metrics are time-lagged, to help provide an accurate benchmark.
How the benchmark was developed
A prototype of the competitiveness benchmark (2024) was developed with support from PwC:
|
The first edition (2025) was an iteration of this prototype, also developed with support from PwC:
|

This second edition (2026) was developed in-house and builds on its predecessors by:
|
Investment areas
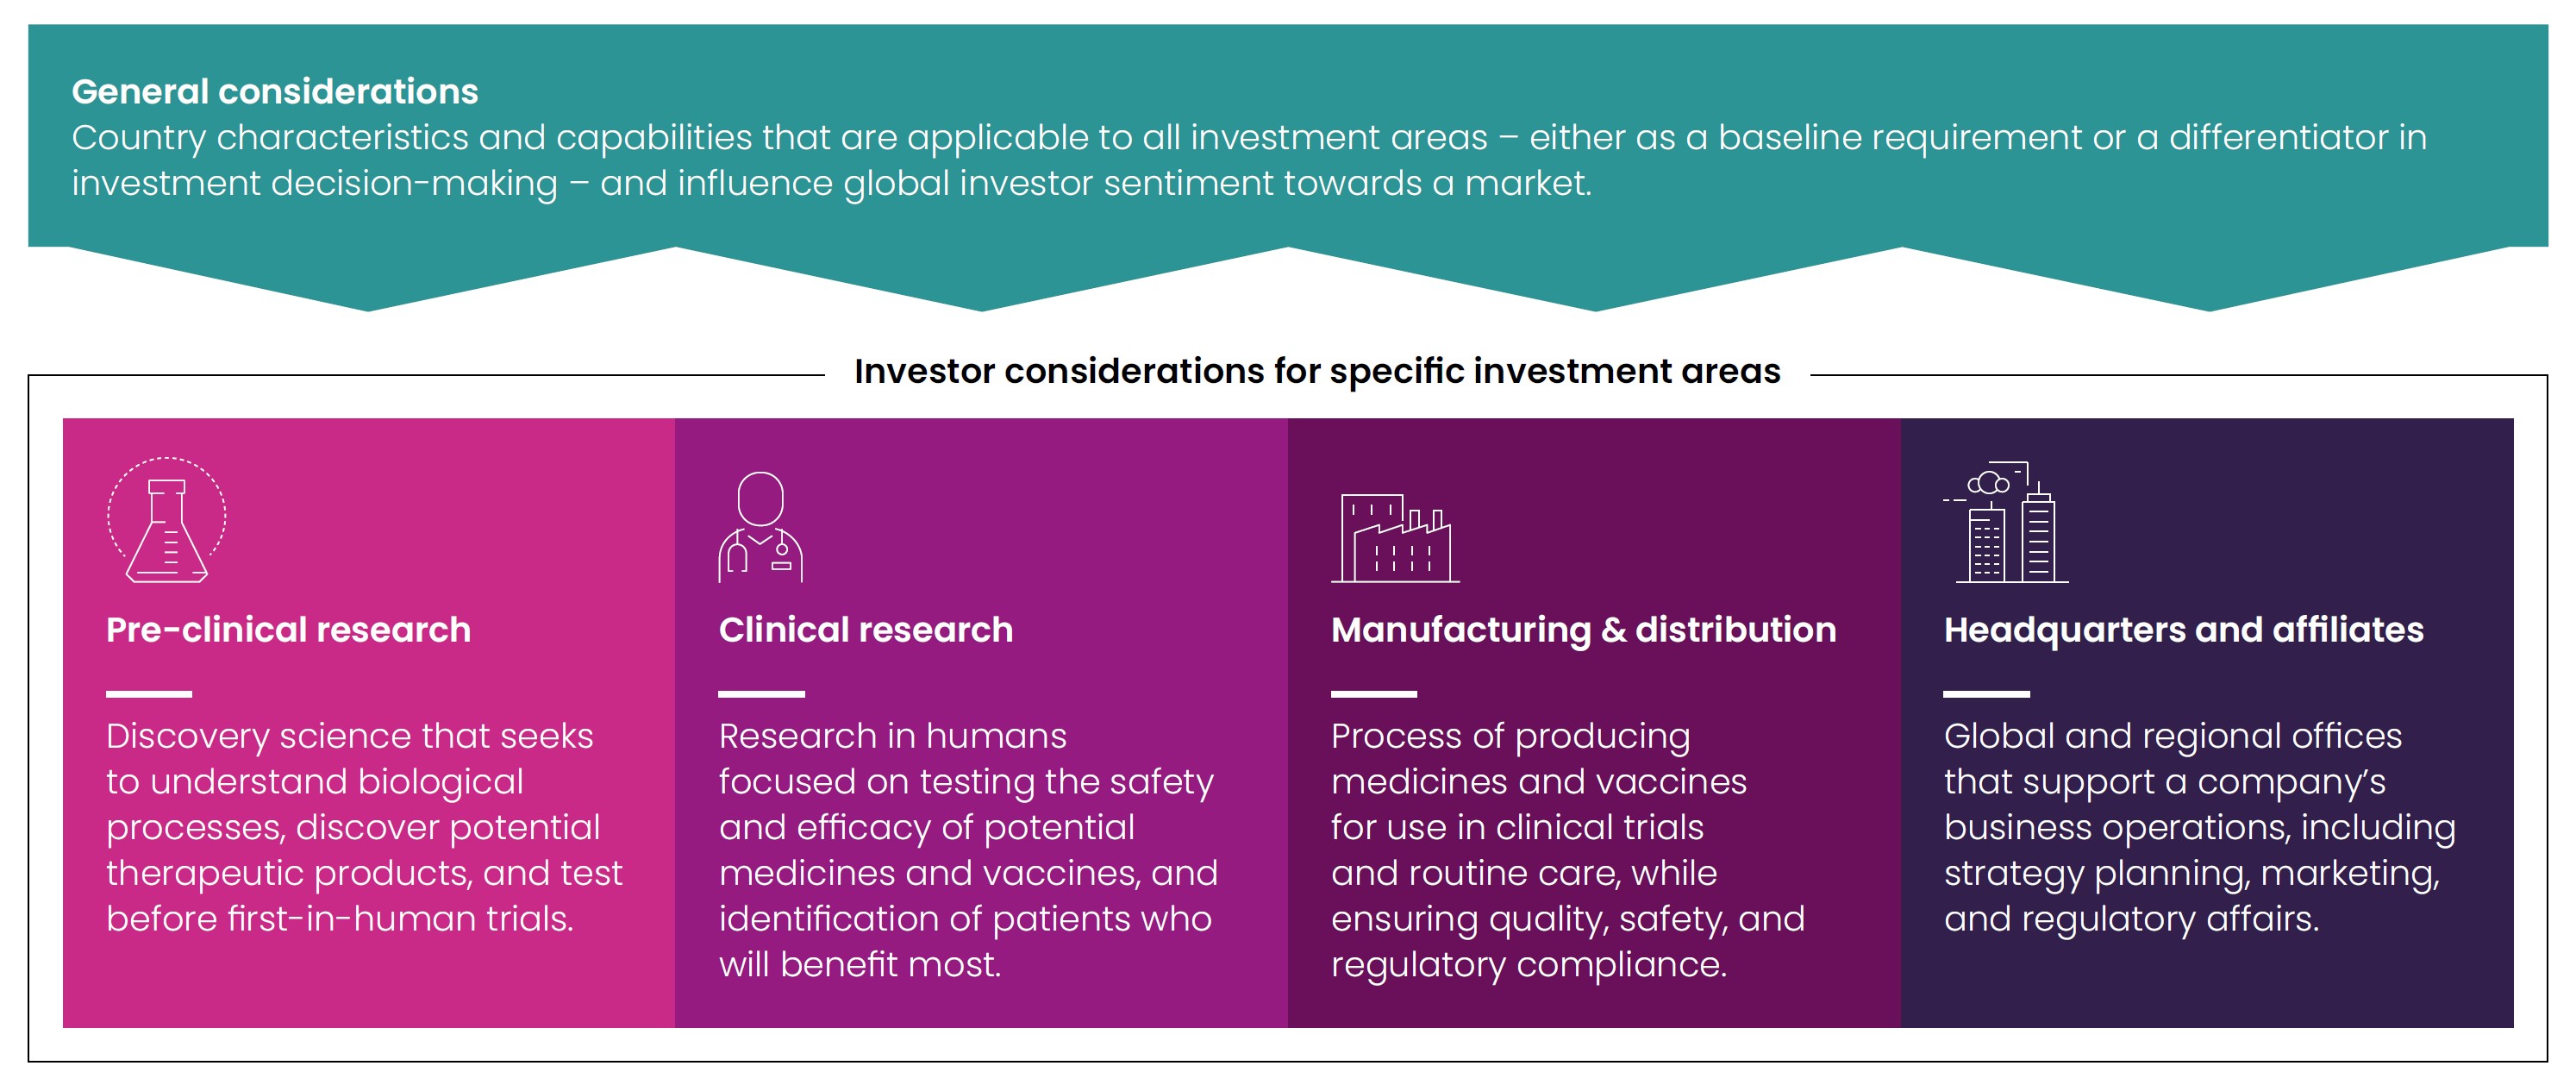
General considerations
| Talent and workforce: Access to a highly skilled workforce is crucial to all areas of investment, as business operations throughout the whole pharmaceutical value chain all rely on skills and knowledge that in many cases require years of training to develop. |

| Political and economic stability: Many areas of pharmaceutical industry investment operate on multi-year, and even multi-decade, timespans, so instability in a country's policy landscape or economy acts as a strong deterrent against inward investment. |

| Intellectual Property protection: A strong IP framework is foundational to industry investment in the high-risk, lengthy process of discovering and developing new medicines that make it to market. |

| Patient access: The ability of patients to access treatments and healthcare that they are eligible to receive has a significant bearing on industry investment by directly impacting the viability of investment, such as clinical trials, and influencing investor sentiment. |

| Reimbursement: Countries that reward and invest in innovation for the benefit of their population's health and economy are much more attractive as destinations to invest and do business because there is less risk that investments will fail to yield a sufficient return. |

| Regulatory environment: The speed and reliability of a regulator can markedly affect the clinical development of innovative products, the timely opening of a new manufacturing site, or the launch of a medicine, with knock-on effects for future investments if key decisions are delayed. |

| Financial incentives: Policies like R&D tax credits help to incentivise investment by reducing upfront costs and the perceived risk of undertaking a medicines development programme, resulting in more R&D than there would be in the absence of incentives. |

| Data and AI capabilities: Pharmaceutical companies are leveraging health data and artificial intelligence to conduct R&D more efficiently and plan their business strategies at an accelerating rate, meaning countries with these capabilities will become increasingly competitive. |

UK pharmaceutical investment competitiveness benchmark 2026: Green shoots, global competition, and the case for delivery
Annual Core Metrics Edition
- UK competitive
- UK semi-competitive
- UK uncompetitive
- Change in UK rank since 2025
General considerations
 Talent & workforce
Level of expertise
Graduates with degrees in natural sciences, mathematics or statistics (%)
Country rankings for Level of expertise.
-
 8.47
8.47
-
 8.30
8.30
-
 8.21
8.21
-
 8.06
8.06
-
 7.98
7.98
-
 7.97
7.97
-
 7.81
7.81
-
 6.93
6.93
-
 4.98
4.98
-
 4.50
4.50
-
 4.27
4.27
Ease of immigration
Costs for skilled worker visa (£)
Country rankings for Ease of immigration.
-
 21
21
-
170
-
172
-
209
-
 248
248
-
276
-
278
-
442
-
675
-
850
-
956
-
7829
-
12451

Political stability
Political stability (index)
Country rankings for Political stability.
-
86.9
-
85.3
-
82.6
-
78.0
-
76.1
-
71.2
-
70.3
-
68.0
-
68.0
-
65.8
-
64.3
-
63.3
-
61.8
Economic stability
Sovereign economic risk (index)
Country rankings for Economic stability.
-
AAA
-
AAA
-
AAA
-
AAA
-
AA+
-
AA+
-
AA
-
AA
-
A+
-
A+
-
A+
-
A+
-
BBB+

Length of additional patent-based protection
Maximum duration of additional patent-based protection [excluding extensions for paediatric research] (years)
Country rankings for Length of additional patent-based protection.
-
5
-
5
-
5
-
5
-
5
-
5
-
5
-
5
-
5
-
5
-
5
-
5
-
2
Length of data-based protection (synthetics)
Period of market exclusivity based on protection of regulatory data [excluding extensions for new indications] (years)
Country rankings for Length of data-based protection (synthetics).
-
10
-
10
-
10
-
10
-
10
-
10
-
10
-
10
-
8
-
8
-
6
-
5
-
5
Length of data-based protection (biologics)
Period of market exclusivity based on protection of regulatory data [excluding extensions for new indications] (years)
Country rankings for Length of data-based protection (biologics).
-
12
-
10
-
10
-
10
-
10
-
10
-
10
-
10
-
10
-
8
-
8
-
6
-
5

Medicines availability
New medicines fully available compared with licence (%)
Country rankings for Medicines availability.
-
93
-
73
-
50
-
49
-
33
-
33
-
30
-
26
Medicines adoption
Median year 3 uptake of NICE-approved new medicines (days of therapy per capita)
Country rankings for Medicines adoption.
-
5.5
-
4.7
-
4.5
-
2.9
-
2.3

Medicines spend
Spending on new, innovative medicines per capita (% of GDP)
Country rankings for Medicines spend.
-
0.78
-
0.53
-
0.46
-
0.40
-
0.36
-
0.32
-
0.29
-
0.28
Clawback rate
Average clawback rate (% of revenue)
Country rankings for Clawback rate.
-
0
-
0
-
0
-
0
-
0
-
0
-
6.45
-
6.83
-
7
-
7.5
-
7.86
-
9
-
14.5

Marketing authorisation approval time
Median days to obtain marketing authorisation approval for new active substances
Country rankings for Marketing authorisation approval time.
-
292
-
322
-
369
-
378
-
413
-
448
-
448
-
448
-
448
-
448
-
448

Research incentives
Implied tax subsidy rates on R&D expenditure for profitable large companies
Country rankings for Research incentives.
-
0.36
-
0.33
-
0.32
-
0.27
-
0.22
-
0.18
-
0.17
-
0.16
-
0.14
-
0.09
-
0.07
-
-0.01
Research incentives
Statutory corporate income tax rates (%)
Country rankings for Research incentives.
-
12.50
-
17.00
-
19.61
-
25.00
-
25.00
-
25.00
-
25.00
-
25.57
-
25.98
-
27.81
-
29.74
-
30.06
-
36.13
Commercialisation incentives
Patent box, lowest possible effective tax rates (%)
Country rankings for Commercialisation incentives.
-
3.75
-
5
-
8.23
-
10
-
10
-
10
-
14.45

AI infrastructure
Number of data centres
Country rankings for AI infrastructure.
-
5427
-
529
-
523
-
449
-
337
-
322
-
222
-
168
AI commercialisation
Number of newly funded AI companies
Country rankings for AI commercialisation.
-
1953
-
172
-
161
-
92
-
84
-
79
-
56
-
49
-
38
-
34
-
33
AI research ecosystem
Number of notable AI models (biology and medicine)
Country rankings for AI research ecosystem.
-
39
-
13
-
9
-
6
-
3
-
2
-
2
Pre-clinical research

Reputation
Number of top 100 universities for life sciences and medicine degrees
Country rankings for Reputation.
-
30
-
16
-
5
-
5
-
4
-
3
-
2
-
2
-
2
-
2
-
2
-
2
-
1
Quality of research output
Global share of most highly cited (top 1%) medical publications (%)
Country rankings for Quality of research output.
-
1.9
-
1.8
-
1.7
-
1.7
-
1.7
-
1.1
-
1.1
-
0.9
Quality of research output
Nature Index for high-quality research outputs in selected journals for health sciences
Country rankings for Quality of research output.
-
12247
-
8461
-
3407
-
2633
-
2011
-
1815
-
1434
-
1270
-
1252
-
1163
-
695
-
516
-
252
Research commercialisation
Number of biotechnology companies
Country rankings for Research commercialisation.
-
9066
-
2424
-
1606
-
1329
-
1126
-
959
-
794
-
580
-
549
-
467
-
332
-
211
-
143
Research commercialisation
Venture capital raised by biotechs (£ million)
Country rankings for Research commercialisation.
-
15515
-
1785
-
807
-
600
-
448

Government funding
Government budget allocations for health R&D (% of GDP)
Country rankings for Government funding.
-
0.17
-
0.12
-
0.07
-
0.07
-
0.07
-
0.06
-
0.06
-
0.03
-
0.01
-
0.01
-
0.00

Government research
Expenditure on medical R&D performed by government (% of GDP)
Country rankings for Government research.
-
0.14
-
0.09
-
0.04
-
0.04
-
0.03
-
0.02
-
0.01
-
0.01
-
0.00
Non-profit research
Expenditure on medical R&D performed by the private non-profit sector (% of GDP)
Country rankings for Non-profit research.
-
0.07
-
0.04
-
0.04
-
0.04
-
0.04
-
0.02
-
0.02
-
0.01
-
0.00
-
0.00
University research
Expenditure on medical R&D performed by the higher education sector (% of GDP)
Country rankings for University research.
-
0.19
-
0.17
-
0.13
-
0.13
-
0.09
-
0.08
-
0.07
-
0.07
-
0.05
-
0.05
Clinical research

Research capacity
Number of clinical trial sites per million population (thousands)
Country rankings for Research capacity.
-
18.1
-
18.1
-
17.8
-
14.9
-
12.5
-
11.2
-
10.4
-
10.1
-
9.6
-
9.0
-
8.6
-
6.3
-
1.0
Research intensity
Number of hospitals delivering over 100 industry clinical trials
Country rankings for Research intensity.
-
933
-
127
-
104
-
97
-
85
-
60
-
56
-
51
-
40
-
21
-
5
-
3
-
2

Medicines availability
New medicines fully available compared with licence (%)
Country rankings for Medicines availability.
-
93
-
73
-
50
-
49
-
33
-
33
-
30
-
26
Medicines adoption
Median year 3 uptake of NICE-approved new medicines (days of therapy per capita)
Country rankings for Medicines adoption.
-
5.5
-
4.7
-
4.5
-
2.9
-
2.3

Study set-up
Median days from clinical trial application to first patient, first dose
Country rankings for Study set-up.
-
174
-
239
-
250
-
252
-
285
-
287
-
300
-
338

Advanced therapies
Number of cell and gene therapy clinical trials initiated
Country rankings for Advanced therapies.
-
346
-
278
-
47
-
36
-
33
-
32
-
29
-
26
-
24
-
10
-
9
-
6
-
2

Scale of enrolment
Global share of patients recruited to a subset of commercial trials (%)
Country rankings for Scale of enrolment.
-
35.2
-
4.3
-
3.2
-
2.9
-
2.7
-
2.4
-
2.1
-
0.2
Manufacturing and distribution

Pharmaceutical manufacturing
Value of global exports of pharmaceutical products (£ billion)
Country rankings for Pharmaceutical manufacturing.
-
102.9
-
102.1
-
93.5
-
92.1
-
49.7
-
47.9
-
45.5
-
35.1
-
24.7
-
16.8
-
12.1
-
9.1
-
8.7
Pharmaceutical manufacturing
Share of global exports of pharmaceutical products (%)
Country rankings for Pharmaceutical manufacturing.
-
13.50
-
11.10
-
10.50
-
10.30
-
6.13
-
5.89
-
4.64
-
3.10
-
2.45
-
1.96
-
1.79
-
1.71
-
1.34
Availability of renewables
Share of total energy supply from renewable sources (%)
Country rankings for Availability of renewables.
-
20.5
-
15.5
-
15.2
-
14.9
-
14.3
-
14.2
-
9.2
-
8.2
-
8.1
-
7.2
-
7.2
-
0.4
Availability of renewables
Generation of energy from renewable sources (GW)
Country rankings for Availability of renewables.
-
2258.0
-
467.9
-
199.9
-
134.5
-
110.5
-
98.6
-
83.6
-
78.3
-
65.1
-
25.6
-
17.1
-
8.1
-
1.7

Ease of obtaining approvals
Operational efficiency of establishing a business location (index)
Country rankings for Ease of obtaining approvals.
-
89.98
-
81.29
-
72.87
-
69.36
-
68.71
-
67.88
-
52.82
-
41.54

Energy costs
Industrial electricity prices excluding taxes (pence per kWh)
Country rankings for Energy costs.
-
6.55
-
11.39
-
11.82
-
12.26
-
12.82
-
14.65
-
15.08
-
20.56
-
22.72
-
24.91

Ease of compliance
Time and cost to comply with export and import requirements (index)
Country rankings for Ease of compliance.
-
78.81
-
71.37
-
70.96
-
67.67
-
66.61
-
60.82
-
43.3
Trade infrastructure
Digital and physical trade infrastructure (index)
Country rankings for Trade infrastructure.
-
46.25
-
42.38
-
40
-
33.53
-
31.31
-
29.58
-
25.78
Cell therapy manufacturing
Share of global exports of cell therapy products (%)
Country rankings for Cell therapy manufacturing.
-
48.50
-
12.10
-
11.00
-
1.24
-
0.92
-
0.81
-
0.44
-
0.38
-
0.07
-
0.03
-
0.01
-
0.00
-
0.00
Headquarters and affiliates

Established industry
Number of pharmaceutical companies
Country rankings for Established industry.
-
927
-
403
-
120
-
119
-
119
-
95
-
87
-
85
-
83
-
75
-
55
-
37
-
25
Emerging industry
Number of biotechnology companies
Country rankings for Emerging industry.
-
9066
-
2424
-
1606
-
1329
-
1126
-
959
-
794
-
580
-
549
-
467
-
332
-
211
-
143

Medicines availability
New medicines fully available compared with licence (%)
Country rankings for Medicines availability.
-
93
-
73
-
50
-
49
-
33
-
33
-
30
-
26
Medicines adoption
Median year 3 uptake of NICE-approved new medicines (days of therapy per capita)
Country rankings for Medicines adoption.
-
5.5
-
4.7
-
4.5
-
2.9
-
2.3
Appendix
What data sources have changed since the 2025 edition?
Medicines spending and adoption: IQVIA data on medicines spending as a percentage of healthcare spending has been replaced with EY data on spending on new, innovative medicines (per capita, per cent of GDP), which is better aligned with the government's target. The OLS (IQVIA) metric on year 3 uptake of NICE-approved medicines relative to peers, which compared inconsistent cohorts of medicines across countries, has been replaced with an ABPI (IQVIA) metric on median year 3 uptake that resolves this issue.
Financial incentives: The OECD's statutory corporate income tax rate has been added.
Health data: The ODI secondary use of health data score has been removed. As a composite of multiple underlying indicators, it did not provide an accurate assessment of researchers' access to health data.
Artificial Intelligence: The IMF AI Preparedness Index, which incorporated broader factors, such as internet access and education, not specific to AI infrastructure, has been replaced with Stanford's count of data centres, which measures countries' capacity to train and operate AI models. Similarly, Nature's data on global share of AI clinical research publications has been replaced with Epoch AI's count of notable AI models in biology and medicine, an updated and more granular source.
Research commercialisation: BIA data on venture capital financing has been added.
Research infrastructure: OLS data on medical R&D expenditure performed by the private non-profit sector has been reclassified from research funding to research infrastructure, correcting an error in the 2025 edition; data for medical R&D performed by government and higher education, also sourced from the OLS, has been added alongside it. The PwC clinical trials infrastructure index was removed because it measured both supply and demand for clinical research capacity.
Planning and permits: Resolution Foundation data on increase in built-up land (m² per capita) has been replaced with the World Bank's index of operational efficiency in establishing a business location, which is updated annually.
Supply chains: Two World Bank indexes have been added to address the lack of supply chain metrics: time and cost to comply with export and import requirements, and digital and physical trade infrastructure. Since these indexes are new and do not yet cover all 12 comparator countries, we have not featured their data in the report's written analysis.
Specialised infrastructure: OEC (UN Comtrade) data on share of global exports of cell therapy products has been added as a proxy metric for specialised infrastructure.
Existing industry presence: GlobalData's count of local affiliates has also been removed, as it duplicated Biotechgate data and covered too few comparator countries.
Domestic talent
Our metric on domestic talent is briefly examined below to prevent misunderstanding of the apparent trends. The UK's trend can be split into two phases with distinct causes.
◆ The first, where graduate output fell from 13.4 per cent in 2019 to 9.22 per cent in 2020, is methodological in nature. The Higher Education Statistics Agency's decision to change its subject coding system from 2019/20 onwards meant that psychology was removed from the biological sciences category,113 shrinking the data that HESA submits to UNESCO for this metric but making it more accurate. A similar phenomenon occurred when France reclassified its subjects in 2014.114
◆ The second, where graduate output fell from 9.22 per cent in 2020 to 7.97 per cent in 2023, is substantive. Output in other subjects grew at a faster rate, increasing the denominator effect, while the output of natural sciences, mathematics, and statistics graduates stagnated or fell. Between 2019/20 and 2023/24, the number of new graduates in mathematical sciences and physical sciences fell by 13 and 5.9 per cent, respectively, while biological sciences grew by just 2.4 per cent; in contrast, the total number of new graduates increased by 7 per cent.115 Since the denominator effect is the primary cause of this decline, and the UK's output is similar to leading comparator countries, the ABPI has rated this metric as a competitive strength, even though its performance has fallen. If the UK's ranking remains middling or falls further, its rating will be downgraded to reflect a sustained drop in global competitiveness.
The United States' trend demonstrates more consistent growth, though the drivers are similarly complex and remain the subject of debate among policymakers:
◆ Unlike the UK's trend, which was driven by a denominator effect, the United States' trend represents genuine growth. Between 2011/12 and 2021/22, the number of bachelor's degrees awarded in biological and biomedical sciences grew by 37 per cent from 95,850 to 131,462.116 In the same period, total output of bachelor's degrees grew by just 12.4 per cent from 1,792,163 to 2,015,035.117
◆ This period of growth coincided with a strategy, developed by the President's Council of Advisors on Science and Technology in 2012, that recommended the federal government commit to train one million additional STEM graduates over the next decade.118 A recent study estimates the United States surpassed this target by a margin of more than 650,000 additional graduates,119 and this success is reflected in our chosen metric. However, it is unclear whether this strategy was responsible for the uptick in STEM education. A 2018 report by the National Academies of Sciences, Engineering and Medicine found that, while many initiatives were created to deliver this strategy, policymakers lacked sufficient indicators to assess whether they were accomplishing their goals.120
◆ Therefore, while policy levers may have contributed to the growth of STEM graduates, including the pronounced growth of life sciences-relevant subjects, the trend is better explained by economics. STEM industries saw significant growth in the United States during this period, increasing demand for STEM graduates. Between 2019 and 2025, STEM sectors created 1.1 million new jobs, an increase of 11.7 per cent, double the 5.5 per cent growth seen in non-STEM employment.121 Of these new STEM jobs, approximately 120,000 were in scientific R&D services.122 While this data provides no breakdown by sector, pharmaceutical R&D is likely to comprise a sizeable proportion of this growth because the industry accounts for one-sixth of business investment in R&D in the United States, with pharmaceutical R&D funded by businesses growing at an average rate of 11 per cent per year, from $80.8 billion in 2019 to $124 billion in 2023.123, 124
It should be noted that the UK government has recently adopted a broader target for training, encompassing both academic and vocational education.125 Since the latter is not measured in our chosen metric, the ABPI will continue to assess whether additional or alternative metrics would more accurately benchmark the UK's domestic talent offer, relative to its competitors, in future editions of this report.
References
Note: Any statistic without a reference is a performance metric in the competitiveness benchmark. Historical trend data for metrics can be provided on request, provided that doing so does not contravene licensing agreements between the ABPI and providers.
ABPI analysis of ONS, 'Business expenditure on research and development UK: 2024', November 2025 and IFPMA 'Always Innovating', June 2026. Available upon request.
ABPI analysis of FT Locations, 'fDi Markets' (GBP 0.76 = USD 1.00), July 2026.
ABPI analysis of FT Locations, 'fDi Markets' (GBP 0.76 = USD 1.00), July 2026.
These policies are recommended in accompanying ABPI reports.
ABPI, 'Creating the conditions for investment and growth', June 2026.
DHSC, 'UK Clinical Research Delivery key performance indicators: data to June 2026', July 2026.
Sterling Pharmaceuticals (£15m, October 2025); GSK (£45m, November 2025); Bristol Myers Squibb (£375m, December 2025); UCB (£500m, January 2026); Orchard Therapeutics (£11m, February 2026); Norgine (£23m, March 2026); GSK (£11m March 2026); Accord (£45m, April 2026); Precision Health Technologies Accelerator (£10m, April 2026); Codis (£25m, April 2026); Boehringer Ingelheim (£150m, April 2026); AstraZeneca (£200m, April 2026); AstraZeneca (£100m, April 2026); Eisai (£48m, June 2026); Siemens (£26m, June 2026); GSK (£400m, July 2026). [Note: Investment values are estimated when not stated in the source.]
DHSC, 'NHS patients get faster access to medicines under new pilots', July 2026.
IQVIA, 'Global Medicine Use Trends 2026', July 2026.
OLS, 'Life Sciences Sector Plan', June 2026.
The Pharma Letter, 'Joining ICH, China FDA embraces global community of regulators', July 2026.
The Economist, 'It's not just AI. China's medicines are surprising the world, too', July 2026.
Pink Sheet, 'China rolls out nationwide 30-day IND pathway for innovative medicines', July 2026.
National Medical Products Administration, 'Policy Interpretation of the NMPA Announcement on Matters Concerning the Importation of Pre-Approval Commercial-Scale Batch Products of Overseas-Marketed Drugs', July 2026.
Center for Drug Evaluation (National Medical Products Administration), 'Notice on Soliciting Public Comments on the Principles and Annex 1 of ICH E6(R3): Technical Guidance on Good Clinical Practice (GCP) for Drug Clinical Trials', July 2026.
McKinsey Global Institute, 'Catalyzing competitiveness: Where investment happens and why', July 2026.
Reuters, 'China biotech licensing boom to hit record in 2026 as pipeline swells', July 2026.
ABPI, 'UK industry clinical trials: Translating actions into impact', July 2026.
Nature Index, 'Major changes to the Nature Index for 2026', June 2026.
ABPI, 'Creating the conditions for investment and growth', June 2026.
The standard deviation between the UK, France, Italy and Germany's global shares of the top 1 per cent most-cited medical publications has gradually fallen from 0.29 in 2013 to 0.10 in 2024.
Germany ranks 1st because its expenditure on medical R&D performed by the private non-profit sector equals 0.073 per cent of GDP. This represents a high level of performance but is likely to overstate Germany's medical research charity ecosystem, as we estimate a sizeable proportion of this expenditure is attributable to the Fraunhofer-Gesellschaft, a network a research institutes that receives both government funding and revenue from contracts.
Clifford Chance, 'The rise of the Chinese biotech sector: How global pharmaceutical companies are responding to China's growing innovation pipeline', July 2026.
McKinsey Global Institute, 'Catalyzing competitiveness: Where investment happens and why', July 2026.
OLS, 'Life Sciences Sector Plan', June 2026.
DSIT, 'Replacing animals in science strategy', June 2026.
ABPI, 'From models to medicines: a landscape review of human-relevant pre-clinical model development in the UK', February 2026.
ONS, 'Earnings and hours worked, occupation by four-digit SOC: ASHE Table 14.7a' (2024 revised edition: gross annual salary, full-time employees), June 2026.
Lightcast, 'Life Sciences 2035: Developing the Skills for Future Growth', March 2025.
Royal Society of Chemistry, 'Setting the record straight on UK chemistry higher education', June 2026.
DFE, 'DfE Update: 28 May 2025', June 2026.
ABPI member companies have consistently reported that they will not fully replace lost Levy funding, hence our expectation that total funding for degree apprenticeships will fall, resulting in less income for universities that training for level 7 apprenticeships.
UK and U.S. data for 2022 is absent from the UNESCO database. The graph begins in 2020 because it is the first year that the UK's Higher Education Statistics Agency implemented its current system for categorising subjects, resulting in an artificial decline from 13.4 per cent In 2019.
U.S. Bureau of Labor Statistics, 'Occupational Employment and Wage Statistics: Science, technology, engineering, and mathematics (STEM) data sets', June 2026.
Lightcast, 'Life Sciences 2035: Developing the Skills for Future Growth', March 2025.
ABPI, 'Pharmaceutical Impact Map', July 2026.
Regulatory Data Protection (RDP): Data-based protection that prevents competitors from using the innovator's pre-clinical and clinical trial data to gain approval for generic medicines for a certain period. In the UK (and current EU law) this regulatory-based protection is made up of eight years of data exclusivity followed by two years of market exclusivity.
Supplementary Protection Certificates (SPC): Patent-based protection that is provided to make up for some of the patent protection time that was lost to the lengthy scientific and regulatory processes involved in developing and approving a new medicine or vaccine.
RAND, ‘The Financial Ecosystem of Pharmaceutical R&D’, July 2026.
IQVIA, ‘Global R&D Trends 2026’, July 2026.
The doctrine of plausibility refers to how the court assesses whether the invention disclosed in a patent was made "plausible" or credible by the patent application. It allows the court to revoke patents due to lack of data in the original patent application.
Further enforcement risks come from the absence of reliable pre-launch notification by generic competitors, the cost and complexity of obtaining preliminary injunctions in the UK, and potential exposure to cross-undertakings benefiting third parties.
Data for England is used to represent the UK because it is the larger market. For comparison, 30 per cent of new medicines approved in Scotland were made fully available for their licensed use in 2021–24. Source: IQVIA, 'EFPIA Patients W.A.I.T. Indicator 2025 Survey', May 2026.
Charles River Associates, 'Benchmarking the UK's cost-effectiveness threshold: findings from international comparison', July 2026.
DHSC, 'NHS patients get faster access to medicines under new pilots', July 2026.
ABPI, 'Delivering a voluntary scheme for health and growth', July 2026
ABPI, 'Industry and academia links survey 2024', July 2026.
HO, 'Restoring control over the immigration system: white paper', July 2026.
HM Government, 'Global Talent visa expanded to attract world's brightest researchers to power British innovation', August 2026.
HO, 'Earned Settlement', July 2026.
Chancenkarte, 'Working in Germany with the Opportunity Card', July 2026.
Make it in Germany, 'The opportunity card – experiences after one year', July 2026.
HM Government, 'UK launches global talent drive to attract world-leading researchers and innovators', July 2026.
European Commission, 'Choose Europe for Science: over 100 national and regional initiatives aim to attract global research talent', July 2026.
ABPI, 'Enhancing the role of UK medicine regulation', December 2024.
DHSC, 'UK Clinical Research Delivery key performance indicators: data to June 2026', July 2026.
HM Government, 'Launch of clinical trial reforms', July 2026.
MHRA, 'Patients to get new medicines up to six months sooner under new joint MHRA-NICE approval process', July 2026.
MHRA, 'Centres of Excellence for Regulatory Science and Innovation', December 2025.
RAND, 'The Financial Ecosystem of Pharmaceutical R&D', July 2026.
HM Government, 'Commercial clinical trials in the UK: the Lord O'Shaughnessy review', June 2026.
OLS, 'Life sciences competitiveness indicators, 2026', July 2026.
ABPI, 'UK industry clinical trials: Translating actions into impact', July 2026.
DHSC, 'UK Clinical Research Delivery key performance indicators: data to June 2026', July 2026.
DHSC, 'UK Clinical Research Delivery key performance indicators: data to June 2026', July 2026.
ABPI, 'UK industry clinical trials: Translating actions into impact', July 2026.
ABPI analysis of data from the VPAG Investment Programme mid-scheme review.
European Commission, 'European Biotech Act', July 2026.
U.S. Department of Health and Human Services', 'HHS launches unprecedented department-wide effort to restore American leadership in clinical trials', July 2026.
Frontier Economics, 'The value of industry clinical trials to the UK – extended report', July 2026.
Frontier Economics, 'The value of industry clinical trials to the UK – extended report', July 2026.
ABPI, 'Globally competitive UK-wide data-enabled clinical trials: the time is now', March 2026.
HM Government, 'Commercial clinical trials in the UK: the Lord O'Shaughnessy review', June 2026.
ABPI, 'Unlocking NHS data for research: how to improve the regional Secure Data Environment network', July 2026.
Analysis undertaken by Flint Global, commissioned by GSK.
For example, the UK's rank rose in 2023 because its corporation tax rate increased from 19 to 25 per cent.
PwC, 'France: Corporate – Tax credits and incentives', July 2026.
HMT, 'Corporate Tax Roadmap 2024', July 2026.
HMRC, 'Evaluation of the research and development expenditure credit', July 2026.
Analysis undertaken by Flint Global, commissioned by GSK.
Houses of the Oireachtas, 'Finance Act 2025', July 2026.
PwC, 'Ireland: Corporate – Tax credits and incentives', July 2026.
EY, '2026 Japan tax reform outline', July 2026.
DSIT, 'Vital medicines and new jobs in over £80 million for UK life sciences', June 2026.
HM Government, 'Life Sciences Sector Plan: One Year On', July 2026.
CEPA, 'Green Book Analysis', September 2025.
OLS, 'Life Sciences Innovative Manufacturing Fund (LSIMF): application guide', July 2025.
The following countries do not have 2023 figures: Germany (2024), Ireland (2022).
Ireland not included in original source, so fee for a Critical Skills Employment Permit sourced from the Irish government's website. Belgium not included in original source, so employer contribution fee and Visa D fee sourced from the Belgian Immigration Office's website.
This index aggregates cross-economy metrics on the likelihood that political power will be challenged through violent, coercive, or unconstitutional means.
Japan operates a unique re-examination system that is similar, but not identical, to Regulatory Data Protection, as it provides a period where generic entrants cannot enter the market.
Japan operates a unique re-examination system that is similar, but not identical, to Regulatory Data Protection, as it provides a period where generic entrants cannot enter the market.
Data shown to represent the UK is England only and based on National Institute for Health and Care Excellence (NICE) decisions. NICE decisions are also recognised by Wales, and Northern Ireland. Separate data for Scotland is available in the original source.
This metric measures median annualised days of therapy, adjusted for population size, in year 3 after local HTA recommendation, among a rolling cohort of medicines that received a positive NICE recommendation in a given period. The number of medicines in each cohort varies for each year, but the cohort is consistent between countries.
UK figure is the minimum clawback rate, excluding Investment Programme payments.
UK figure not included in the original source and has kindly been provided by the MHRA (measures marketing authorisation via the national/Project ORBIS route).
Combined corporate income tax rate, general government. The following countries do not have 2025 figures: China (2024), Singapore (2024).
The different patent box systems have varying scopes and eligibility requirements, so minimum rates are illustrative. Note that Switzerland's patent box varies from canton to canton, with the lowest-tax canton, Zug, offers up to a 90 per cent exemption from corporate tax.
A database of notable AI models was narrowed to models related to biology or medicine. From this refined list, we calculate a country's cumulative number of models according to the nationality of a model's developers. Models with multi-national development teams count for each country involved.
Absolute count of a country's production of research articles published in a list of journals selected by health sciences researchers surveyed by Nature. The 2026 edition data reflects a large expansion of the Nature Index's list of journals.
United States figures only cover the states of California, Massachusetts, and New York.
The following countries do not have 2024 figures: United Kingdom (2023), Canada (2022).
The following countries do not have 2023 figures: Singapore (2022).
The following countries do not have 2023 figures: United Kingdom (2017), Singapore (2022).
Count of sites obtained by filtering Trialtrove results to include trials initiated in 2024, tagged as ongoing / completed. Value then divided by country population.
Sites obtained by filtering Trialtrove results to include trials initiated in 2024, tagged as ongoing / completed. Those delivering 100+ trials were counted.
Count of trials obtained by filtering Trialtrove results to include trials initiated in 2024 that are ongoing / completed and involved a Cellular or Gene Therapy.
Data aligns with Harmonized System (HS) 2022. China's value is lower than expected because most APIs are included under the organic chemicals or other chemical HS codes, not the HS codes for pharmaceutical products.
Renewables include hydropower, solar, wind, geothermal, bioenergy, wave, and tidal. 2024 figures because the Energy Institute revised its measure of 'Total Energy Supply' in 2025. Ireland-specific figures are unavailable.
This index aggregates cross-economy metrics on construction permits, property transfer, and land administration. The 2026 edition of the World Bank's B-READY report will add France, Germany, Japan, China and Switzerland.
This index aggregates metrics on electronic systems, public information, and infrastructure used for trade.
Harmonized System 2022 is used. Note that the Netherlands is the world's second-largest exporter of cell therapy products, accounting for 23 per cent of global exports in 2024.
HESA, 'Higher Education Student Statistics: UK, 2019/20 – Notes', June 2026.
Légifrance, 'Decree of 22 January 2014 establishing the national framework for degree programmes leading to the award of national bachelor's, professional bachelor's and master's degrees', June 2026.
HESA, 'Higher Education Student Statistics: UK, 2023/24 - Qualifications achieved' (level of qualification: first degree; mode of study: full time), June 2026.
National Center for Education Statistics, 'Undergraduate Degree Fields: Figure 4', June 2026.
National Center for Education Statistics, 'Bachelor's degrees conferred by postsecondary institutions, by field of study: Selected academic years, 1970-71 through 2021-22', June 2026.
President's Council of Advisors on Science and technology, 'Engage to excel', June 2026.
Journal of Microbiology & Biology Education, 'One million more: assessing a decade of progress in undergraduate STEM education', June 2026.
The National Academies, 'Indicators for Monitoring Undergraduate STEM Education (2018)', June 2026.
U.S. Bureau of Labor Statistics, 'Occupational Employment and Wage Statistics: Science, technology, engineering, and mathematics (STEM) data sets', June 2026.
U.S. Bureau of Labor Statistics, 'Occupational Employment and Wage Statistics: Science, technology, engineering, and mathematics (STEM) data sets', June 2026.
National Center for Science and Engineering Statistics, 'Business R&D performance in the United States increases to $722 billion in 2023', June 2026.
National Center for Science and Engineering Statistics, 'Businesses Reported an 11.8% Increase to Nearly a Half Trillion Dollars for U.S. R&D Performance During 2019', June 2026.
Prime Minister's Office, 'Prime Minister unveils reforms to transform further and higher education', June 2026.
-
ThemeValue
-
KeywordsVPAG
-
PublisherABPI
-
Last reviewed date04 September 2026
-
Next review date04 September 2031
Related content

News |
Green shoots for UK pharma investment, but delivery will decide whether they take root
New ABPI report finds £2bn in fresh pharma investment since September 2025, but warns the UK's recovery depends on delivering committed reforms.

News |
VPAG payment rate for newer medicines will be 14.5% in 2026
The government has announced that the 2026 payment rate for newer medicines under the Voluntary Scheme for Branded Medicines Pricing and Access (VPAG) will be 14.5 per cent, down from a record 22.5 per cent in 2025.

News |
Companies granted third extension to VPAG 2026 decision deadline – now set for 16 December
The ABPI and the government have agreed to a further extension to the deadline by which companies must give notice if they intend to leave the 2024 voluntary scheme for branded medicines pricing, access and growth (VPAG). The revised deadline for submitting notice to leave the VPAG scheme is now 16 December 2025.