
Executive summary
In 2019, the National Institute for Health and Care Excellence (NICE) initiated a significant review of the methods and processes used to evaluate health technologies. The review concluded in early 2022 with the publication of a new Health Technology Evaluation (HTE) Manual.1 Since the publication of the methods update, NICE has initiated a programme of modular updates to its processes and methods, with the aim to “keep [our] methods flexible and responsive to changes in health and care”.2 Completed updates of relevance for the evaluation of medicines include process guidance on cost-comparisons and streamlined decision-making in October 2023, and guidance on the approach to providing evidence on the impact of health inequalities and how this affects decision-making in May 2025.3
To help monitor the implementation of the HTE Manual, the ABPI launched an initiative – Continuous NICE Implementation Evaluation (CONNIE) – to collect feedback from companies on completion of their appraisals.4 This indepth feedback has been maintained, allowing the ABPI to monitor trends in the evidence submitted by companies and how NICE is making its decision.
Questions have been added to the CONNIE platform to assess the impact of modular updates. This report is the fourth in the ABPI’s CONNIE series and captures feedback from 112 completed evaluations and one terminated appraisal (representative of 54 per cent of all topics that have concluded in the analysis timeframe when terminated appraisals are excluded).
Given the challenging broader commercial environment for medicines and the critical juncture at which the UK currently finds itself, it is more important than ever to ensure NICE’s methods and processes are fit for purpose and can adequately value and support the timely introduction of new medicines and indications into the NHS.
Key insights from the analysis
- Severity modifier: Seventy-two per cent of eligible topics in CONNIE received no severity weighting. For oncology topics, 59 per cent received no weighting and of these topics 34 per cent would have met NICE’s end-of-life criteria and therefore are being assigned less value under the severity modifier.
- Management of uncertainty and decision-making ICERs:
- The proportion of topics where the decision-making ICER is closer to the Evidence Assessment Group (EAG) ICER increased from 55 per cent of topics in 2023-2024 to 70 per cent of topics in 2024-2025.
- The committee’s decision-making threshold was in the lower end of the cost-effectiveness range or below £20,000 in most topics (56 per cent).
- Double counting of uncertainty (where the appraisal committee accounts for uncertainty both by taking risk-averse assumptions on parameter uncertainty and using a decision ICER threshold at the lower end of the £20,000-£30,000 range) was reported by companies in 20 per cent of topics.
- Taken together, the evidence on uncertainty suggests that committees may be becoming increasingly risk averse and showing a preference for assigning decision-making thresholds in the lower end of the cost-effectiveness threshold range.
- Non-reference case flexibilities: There were no examples of topics where the non-reference-case discount rate was granted and only two examples of topics where wider societal benefits were partially accepted.
- Evidence sources:
- Companies submitted the highest level of evidence for surrogate endpoints in most cases, and this was accepted by committees.
- The proportion of topics where real-world evidence is submitted and accepted has remained stable.
- The number of topics where carer quality-of-life evidence is submitted by companies is increasing. When evidence on carer quality of life was used in the ICER calculation, it was accepted by committees in all but one case. However, when the evidence was excluded from the ICER, additional flexibilities were applied only once. Additional guidance for companies and committee members on incorporating and evaluating carer quality-of-life evidence would be valuable.
CONNIE analysis
Note: CONNIE captures company feedback and the analysis presented does not attempt to determine whether modifiers and flexibilities should or should not have been applied in any particular evaluation.
1. Sample
Building on the 72 topics outlined in the previous CONNIE report (CONNIE: Round 3), this latest report (CONNIE: Round 4) includes an additional 44 topics. Therefore, the total sample includes data for 112 topics that have completed their evaluation (to publication of final guidance), up to May 2025, using the methods set out in the current HTE Manual. The sample includes 89 (79 per cent) single technology appraisals (STAs), 12 (11 per cent) cost comparison appraisals, one (<1 per cent) multiple technology appraisal (MTA), seven (6 per cent) Cancer Drugs Fund (CDF)/Innovative Medicines Fund (IMF) exit appraisals, two (2 per cent) highly specialised technology (HST) evaluations and one (<1 per cent) other topic. The sample represents 54 per cent of all topics using the updated methods set out in the HTE Manual that have concluded in the period August 2022 to May 2025.
Date of final guidance publication
Where analysis of trends over time are of interest, this report present results for the financial year, to align with NICE’s reporting periods.
Table 1 outlines the number of topics from CONNIE Round 1-4 reports by date of final guidance publication.
Table 1: CONNIE rounds by date of final guidance publication
| 2022/23, topics (%) |
2023/24 topics (%) |
2024/25 topics (%) |
H1 2025/26 topics (%) |
Total | |
|---|---|---|---|---|---|
| CONNIE: Round 1 |
7 (78%) | 13 (29%) | 0 (0%) | 0 (0%) | 20 (18%) |
| CONNIE: Round 2 |
2 (22%) | 17 (38%) | 0 (0%) | 0 (0%) | 19 (17%) |
| CONNIE: Round 3 |
0 (0%) | 14 (31%) | 15 (32%) | 0 (0%) | 29 (26%) |
| CONNIE: Round 4 |
0 (0%) | 1 (2%) | 32 (68%) | 11 (100%) | 44 (39%) |
| Total | 9 (100%) | 45 (100%) | 47 (100%) | 11 (100%) | 112 (100%) |
Sample characteristics
- Forty-eight (43 per cent) new active substances and 64 (57 per cent) licence extensions.
- Eighty-one (72 per cent) monotherapies, 21 (19 per cent) combination therapies with generics, and 10 (9 per cent) combination therapies with other branded medicine(s).
- Sixty-two (55 per cent) common indications, 43 (38 per cent) orphan indications, and seven (6 per cent) ultra-orphan indications.
- Four (4 per cent) ATMPs.
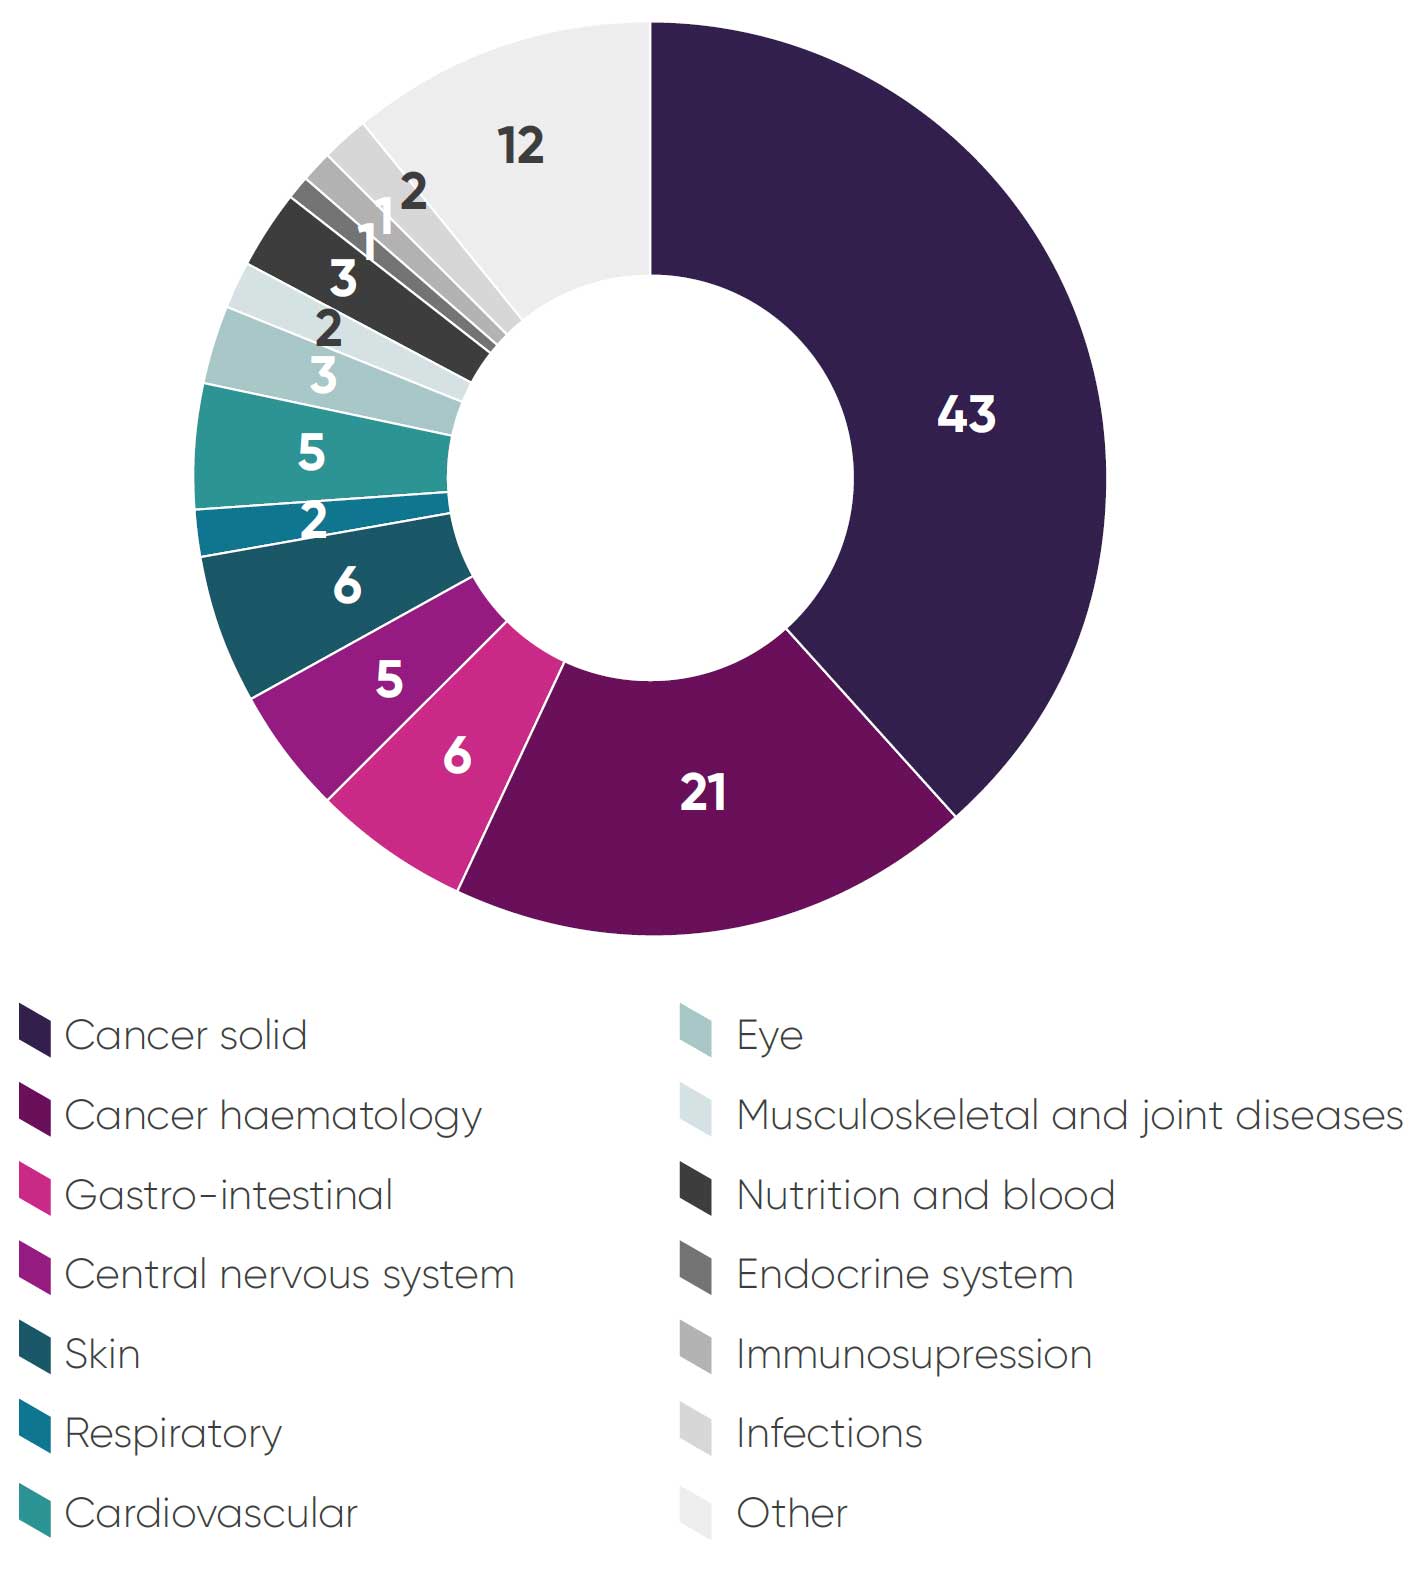
- Sixty-four (57 per cent) cancer medicines (Figure 1: Breakdown of topics by therapy area).
- Sixty-nine (62 per cent) first in class, 21 (19 per cent) second in class, 12 (11 per cent) third in class, two (2 per cent) fourth in class, and eight (7 per cent) other/ unknown position in class.
- The topics covered a representative range of all five NICE appraisal committees.
Figure 1: Breakdown of topics by therapy area
2. NICE guidance outcomes
Seventy-nine topics (71 per cent) were fully recommended, 17 (15 per cent) were optimised, five (4 per cent) were recommended for use in the CDF/IMF, nine (8 per cent) were not recommended and one (1 per cent) was terminated (Table 2).
Table 2: NICE guidance outcomes for CONNIE topics
| 2022/23 | 2023/24 | 2024/25 | 2025/26 | Total | |
|---|---|---|---|---|---|
| Recommended |
7
78%
|
29
64%
|
35
74%
|
8
73%
|
79
71%
|
| CDF (recommended) |
1
11%
|
2
4%
|
2
4%
|
– |
5
4%
|
| Optimised |
1
11%
|
8
18%
|
5
11%
|
3
27%
|
17
15%$
|
| IMF (recommended) | – | – |
1
2%
|
– |
1
1%
|
| Not recommended | – |
6
13%
|
3
6%
|
– |
9
8%
|
| Terminated | – | – |
1
2%
|
– |
1
1%
|
| Total |
9
100%
|
45
100%
|
47
100%
|
11
100%
|
112
100%
|
In order to validate the CONNIE dataset, a comparison of technology appraisal outcomes was conducted against outcomes of all NICE appraisals in a comparable time period (Figure 2). Largely, the CONNIE dataset is representative of a typical NICE sample with respect to outcomes. The CONNIE dataset outcomes reflect a higher proportion of fully recommended topics and a lower proportion of optimised topics – this is likely because companies are reporting some optimised appraisals as recommended in CONNIE feedback.
Figure 2: Guidance outcomes in all NICE appraisals August 2022 to May 2025
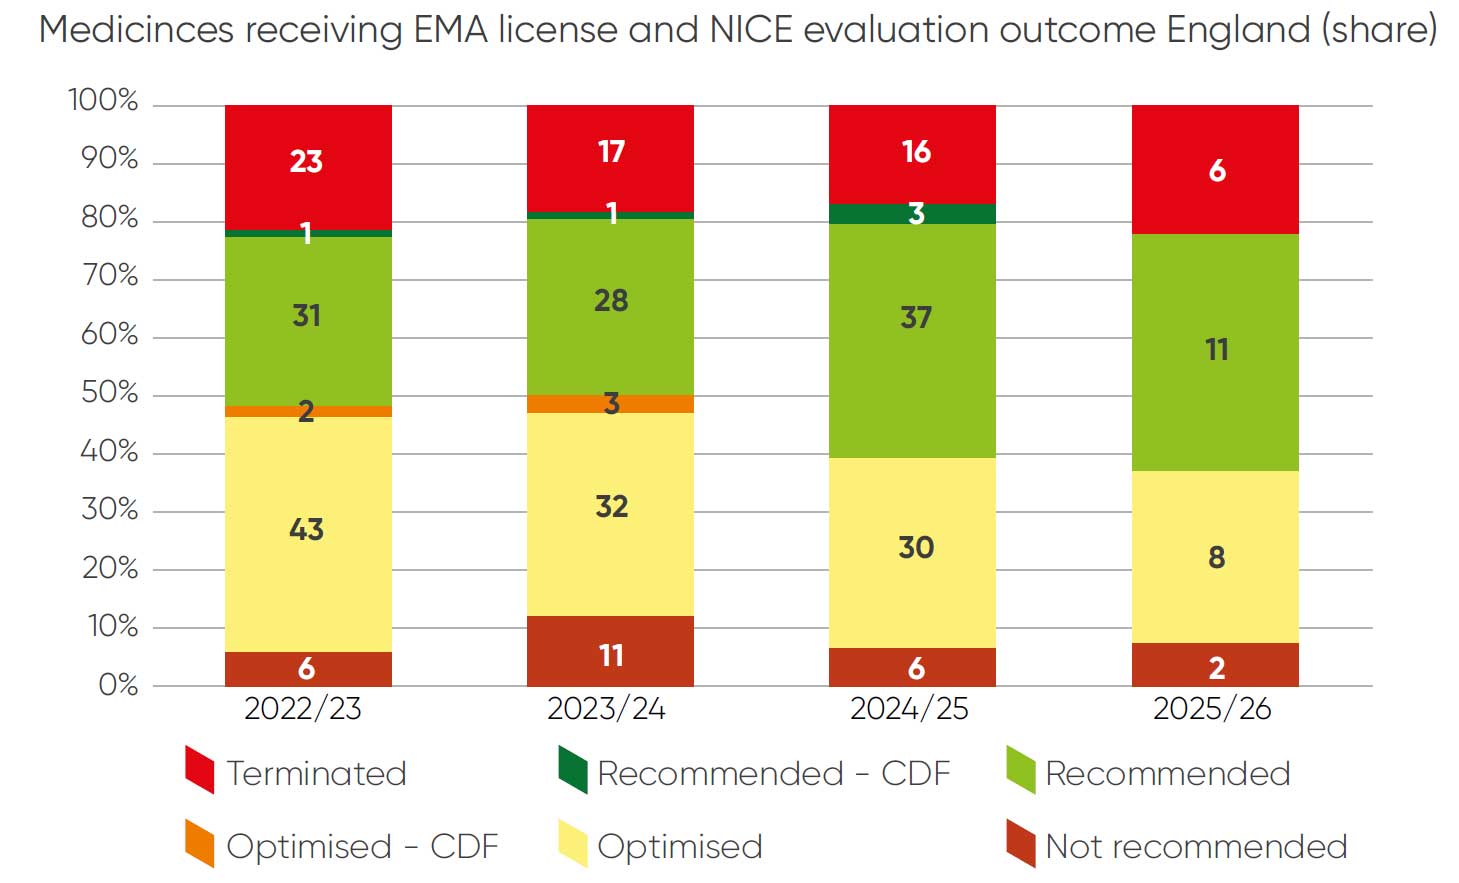
The CONNIE database contains a lower proportion of terminated appraisals. This is because data collection on terminated appraisals only began in the current round of data collection and so the sample is not representative of the extent of terminations that remain approximately one fifth of the NICE work programme.
3. Process steps and timing
Evaluation scheduling (reported as companies receiving an invitation to participate) was on time for 84 topics (75 per cent). Ten topics (9 per cent) were delayed by NICE, and 16 topics (14 per cent) were delayed by companies.
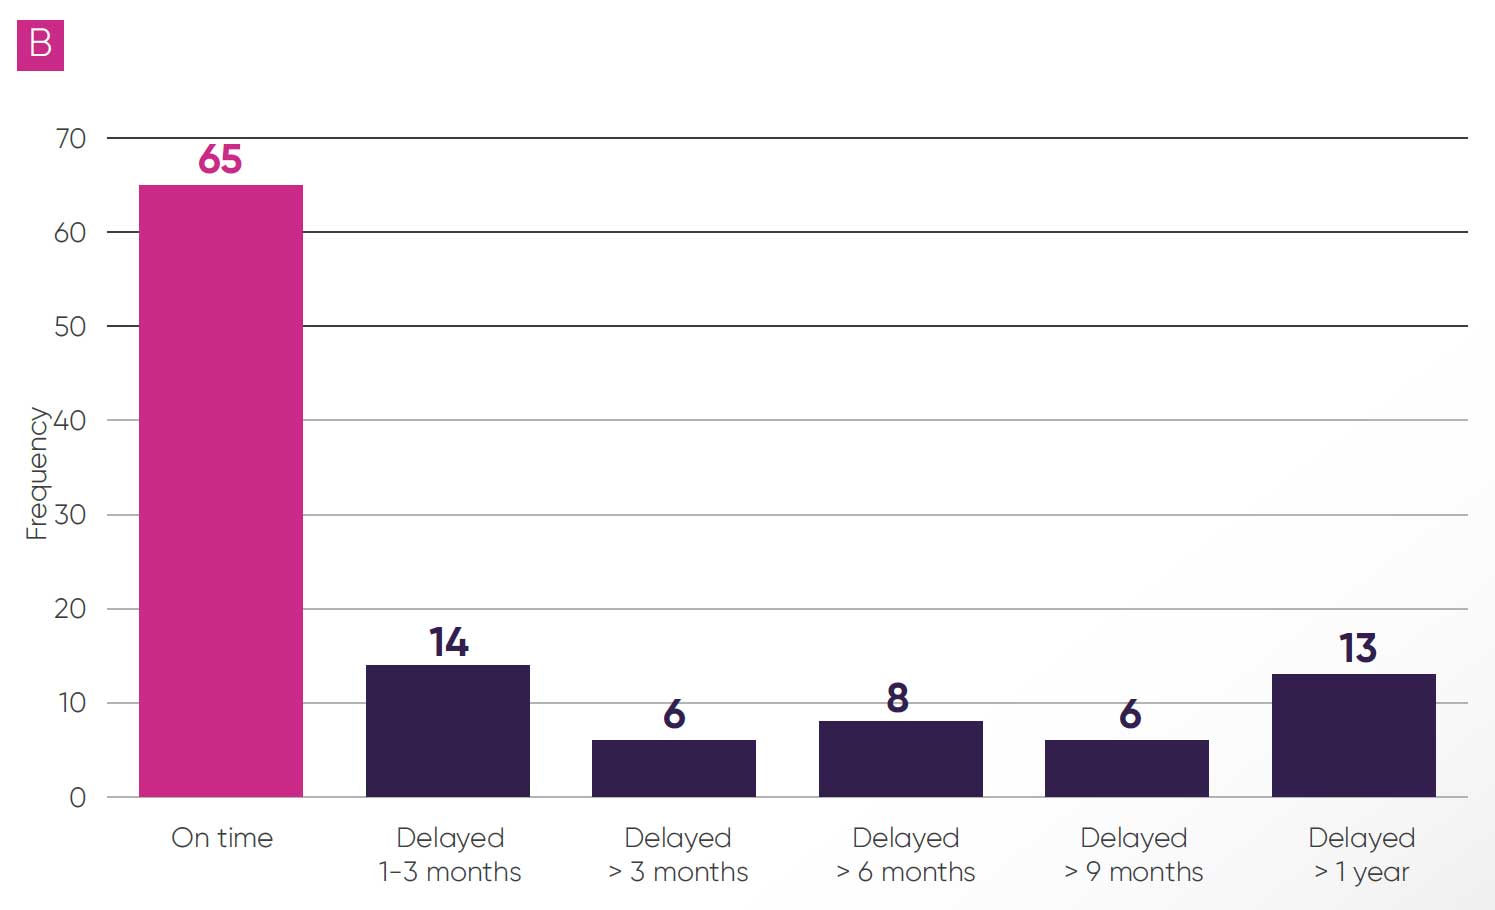
Some delays were reported during the evaluation process for 57 topics (51 per cent); these were predominantly due to NICE (33 topics, 30 per cent, as per Figure 3A). The most cited reasons for delays were for “operational” reasons, alongside delays in publication of the EAG report and requests for additional evidence from the committee or EAG. There were also delays to publication of final guidance in 47 topics (42 per cent, as per Figure 3B), and in 27 of these topics (24 per cent) delays were greater than six months and in 13 (12 per cent) delays were greater than a year.
Figure 3: Delays reported during the evaluation (A)
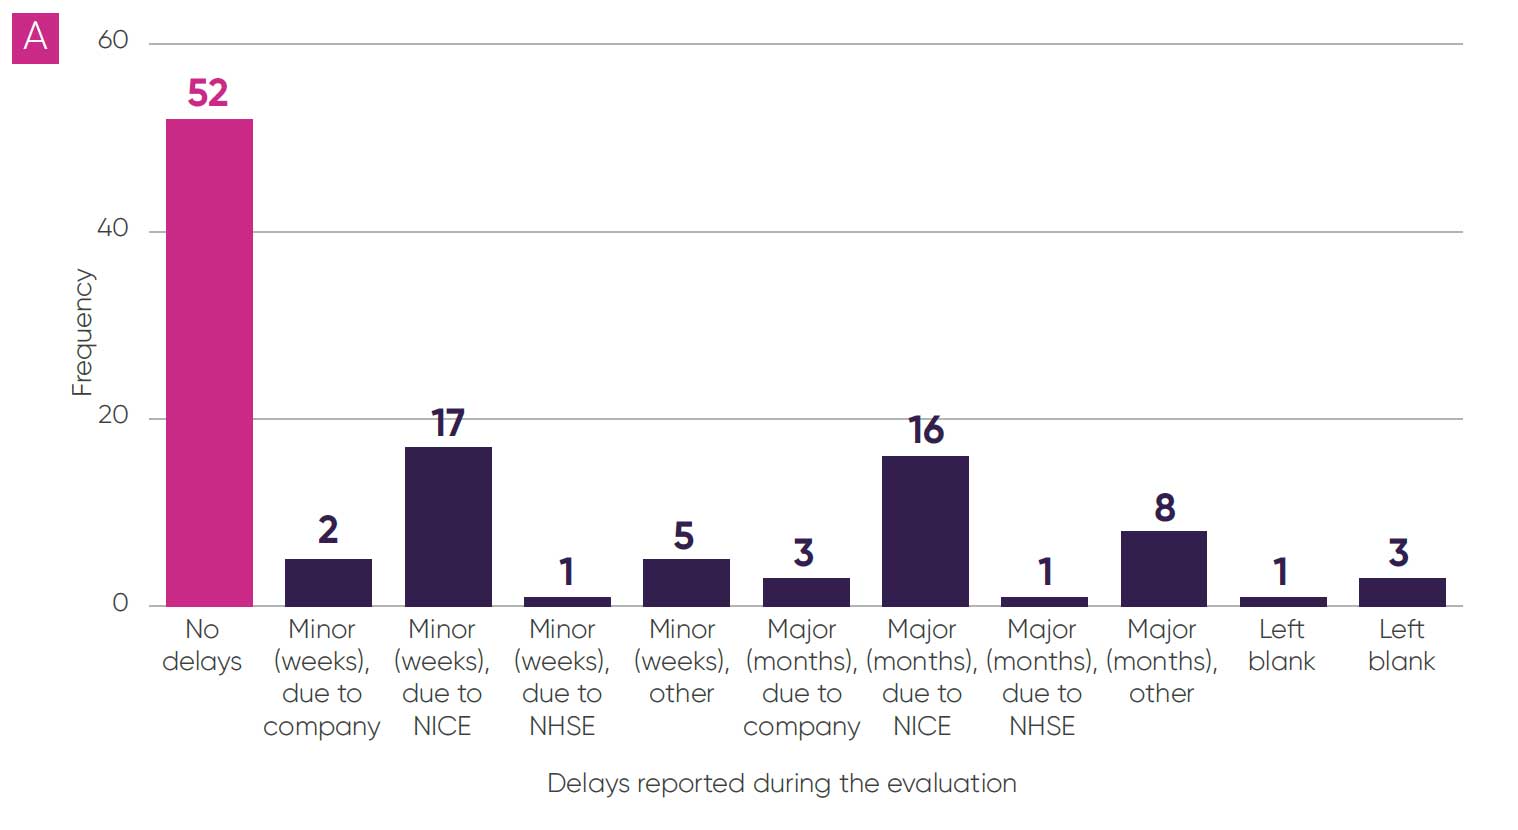
Figure 3: Delays reported during the final guidance publication (B)
Technical engagement
Technical engagement is a process step to allow discussions between a company, the EAG and the NICE technical team to identify and consider any evidence gaps, issues and potential resolutions ahead of the committee meeting. It is no longer routinely scheduled as part of an appraisal. Forty-four topics (39 per cent) had technical engagement (see Table 3). Results indicate there is a continuing trend towards less use of technical engagement with very few technical engagements being held. Where technical engagement was used, it was considered helpful in most cases (73 per cent). The ABPI highlights that while not using the technical engagement step is potentially time saving, the ability to resolve some issues before the first Appraisal Committee Meeting (ACM) was useful, and that NICE should take a pragmatic approach towards efforts to resolve key issues following publication of the EAG report and in advance of the ACM to ensure that committee meetings remain focused on the most important issues for decision-making.
Table 3: Number of topics with technical engagement
Appraisal committee meetings
NICE clarified its process for cost-comparison topics in October 2023.3 Since these clarifications all cost-comparison topics have completed with either one ACM or with a subset of the committee making a decision outside of a formal ACM. This proportionate approach to more straightforward topics is welcome and frees up committee capacity for consideration of more complex evaluations.
For topics where the cost-comparison process was not used, the average number of committee meetings per topic was 1.62 (see Table 4) with an increasing number of committee meetings observed in more recent time periods (an increase from 1.5 meetings in 2022/23 to 1.82 meetings in 2025/2026 to date). From the comments received, we surmise that a potential driver of this could be committees being increasingly risk averse and preferring to have subsequent meetings before making a decision.
Table 4: Number of appraisal committee meetings needed to conclude each topic
4. Severity modifier
The severity modifier is a critical element of NICE’s methods that determines whether medicines will be recommended for use in the NHS. It was implemented in an ‘opportunity-cost-neutral’ way, designed to have an overall magnitude similar to that applied under the old end-of-life modifier, until more evidence is available to inform the approach. By definition and design, this represents a retrograde step for access to some cancer medicines that would previously have been granted the end-of-life modifier weighting. The definitions for ‘severe’ and ‘very severe’ are too stringent and there is an urgent need to evolve the modifier to take better account of societal preferences and improve how medicines are valued.
Table 5 shows the proportion of topics that receive each weighting in the CONNIE data for company-reported utilisation of the severity modifier. All analyses related to the severity modifier exclude cost-comparison topics (100 topics). Across the sample, 5.7 topics (6 per cent) received the higher QALY weighting (x1.7), 23.6 topics (24 per cent) received the lower QALY weighting (x1.2), and 71.7 topics (72 per cent) received no QALY weighting.i
Table 5: Percentage of topics applicable for severity modifier when designed, compared to percentage of topics the severity modifier was applied to in its implementation (committee-assigned QALY weights)
An approach to reviewing whether the modifier is being implemented as opportunity cost neutral is to look at the average QALY weighting granted per topic. A full description of the design of the severity modifier and alternative approaches is available in the preceding CONNIE report.5 As the data to conduct an analysis using decisions as a denominator is not available in the CONNIE database, we have maintained an approach of using topics as the denominator to calculate the QALY weighting, while acknowledging that NICE’s preferred metric is to use number of decisions as the denominator. Using topics as denominator, the average QALY weighting in the CONNIE database is 1.085, which is lower than the expected average QALY weighting by design (1.102) or by opportunity cost neutrality (1.157).
When considering oncology specifically, of the 62 oncology topics in CONNIE, 5.7 topics (9 per cent) received the higher x1.7 QALY weighting, 19.6 topics (32 per cent) received the lower x1.2 QALY weighting and 36.7 topics (59 per cent) received no weighting.
Companies reported that 21 of these topics (34 per cent) would have met NICE’s end-of-life criteria and therefore would have been eligible for approval at a cost-effectiveness threshold of up to £50,000. Of these topics, three (14 per cent) were not recommended and 10 (48 per cent) were delayed. In four topics (19 per cent) delays were greater than a year. Two of the topics that were not recommended were for gastric cancer and one was for breast cancer.
When considering rare conditions, of the 48 topics for orphan and ultra-orphan conditions in CONNIE, 2.5 topics (5%) received the higher x1.7 QALY weighting, 13.3 topics (28 per cent) received the lower x1.2 QALY weighting and 32.2 topics (67 per cent) received no weighting. This is broadly in line with results for the full CONNIE sample.
Table 6: Average QALY weighting for oncology and rare-disease topics under end-of-life versus severity-modifier design
The ABPI continues to be concerned about the severity modifier delaying or preventing access to important medicines and the impact this will increasingly have on patients.
Available research by the Office of Health Economics (OHE) into public preferences shows support for lower proportional shortfall (PS) and absolute shortfall (AS) threshold values to be applied.6 The public indicated that ‘severe’ health states started around 50% PS (compared to NICE’s 85%) and that ‘very severe’ health states begin around 65% (compared to NICE’s 95%).
The severity modifier needs to better value medicines that are improving and extending the lives of patients with devastating diseases. Given NICE’s research on societal preferences for severity has only just started, three years after it was committed to, the ABPI recommends NICE makes an interim change to the severity modifier to adjust downwards the cut-off levels used to determine the degree of severity. This would better reflect existing evidence on societal preferences and is urgently needed to prevent patients missing out on important treatments.
5. Spotlight on uncertainty and decision-making
The third CONNIE report highlighted concerns from the ABPI about the relationship between uncertainty and the decision-making ICER threshold. Specifically, there were concerns that:
- committees were increasingly risk averse, aligning with more conservative EAG assumptions on key parameters
- committees were increasingly applying a decision-making cost-effectiveness threshold in the lower end of the £20,000 to £30,000 cost per QALY range
- these two approaches were being applied in tandem, resulting in effective ‘double counting’ of uncertainty
To explore this further, additional questions were added to the latest round of CONNIE data exploring whether companies perceived there to be ‘double counting’ of uncertainty and indicating the number of key parameters where the committee’s preference was for the company’s preferred assumption, the EAG’s preferred assumption or in between.
Decision-making ICERs
For the 78 topics where the decision-making ICER was clear, 46 (59 per cent) were closer to the EAG estimate than the company base case. There has been an increasing trend (Figure 4) towards a preference for the EAG estimate, from 55 per cent of topics in 2023/2024 to 70 per cent of topics in 2024/2025.ii
Figure 4: Company-reported view on whether ICER is closer to company or EAG estimate, or at a mid-point of these estimates
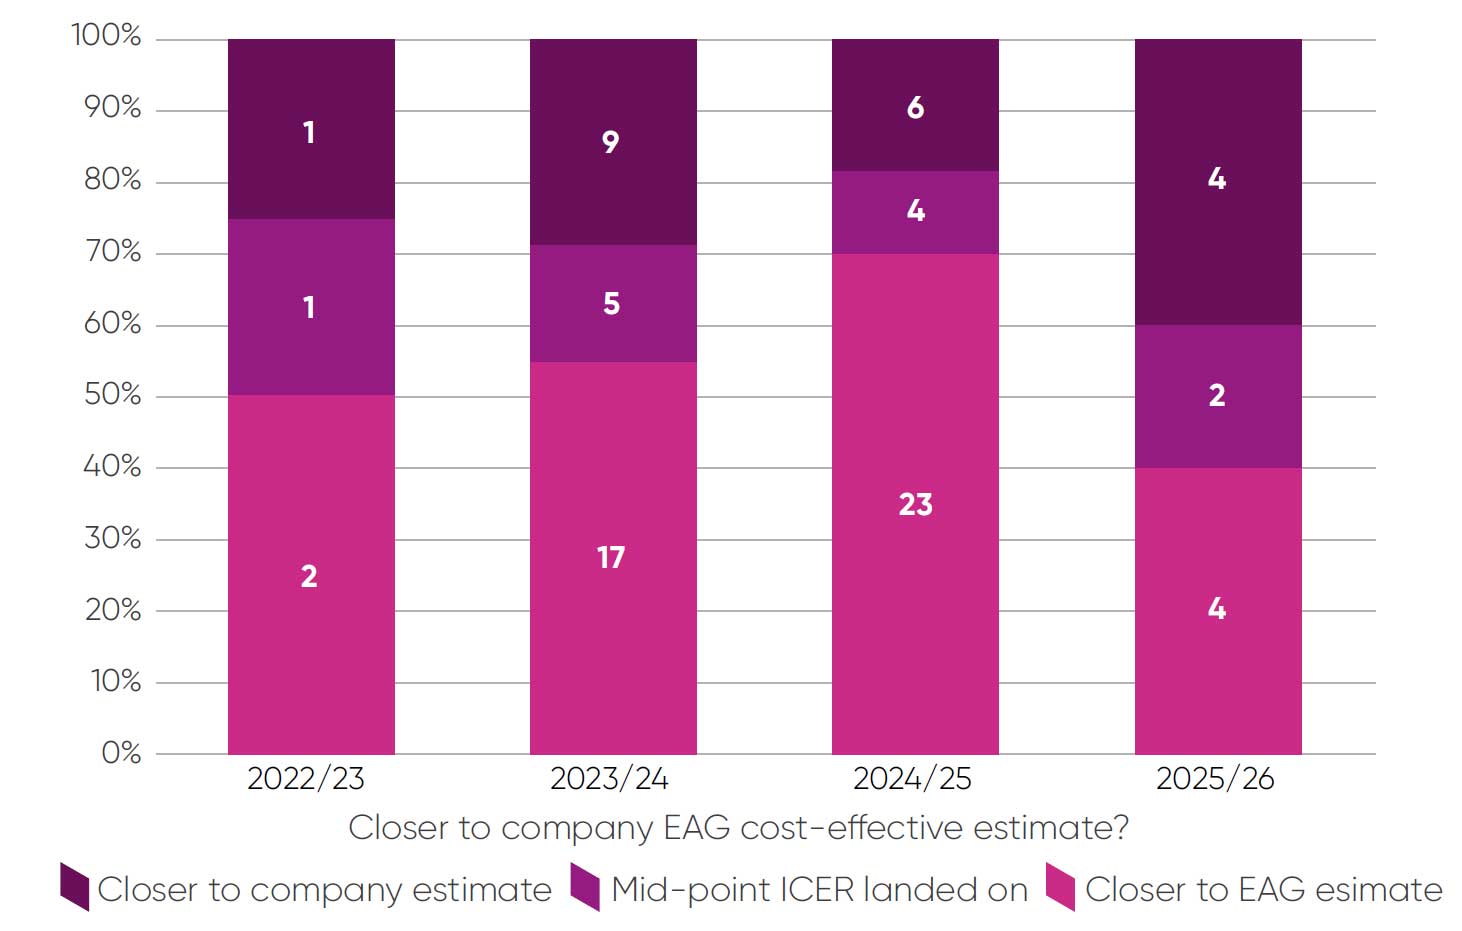
Companies reported detailed evidence on uncertainty over key parameters for 21 of 35 topics where this question applied. In 13 (62 per cent) of these topics the committee preferred the EAG assumptions for most parameters, in three (14 per cent) the committee preferred company assumptions and for four (19 per cent) it preferred assumptions at mid-point of company/EAG estimates or an equal number of company and EAG assumptions. One response was left blank. One key limitation of these data is that the relative contribution of each key parameter cannot be captured. We also cannot exclude the possibility of selection bias in the type of topics where companies report these data. Continuing to monitor these trends over time will be valuable.
Decision-making thresholds
Forty-five of 81 STA topics (54 per cent) reported decision-making thresholds in the lower end of the cost-effectiveness thresholdiii or below £20,000 (Figure 5). With the exception of 2024/2025, most decision-making cost-effectiveness thresholds have been reported in the lower end of the cost-effectiveness threshold or below £20,000. In 2025/2026 to date only one topic in the sample has a decision-making ICER above £26,000.
Figure 5: Committee decision-making ICER threshold ranges
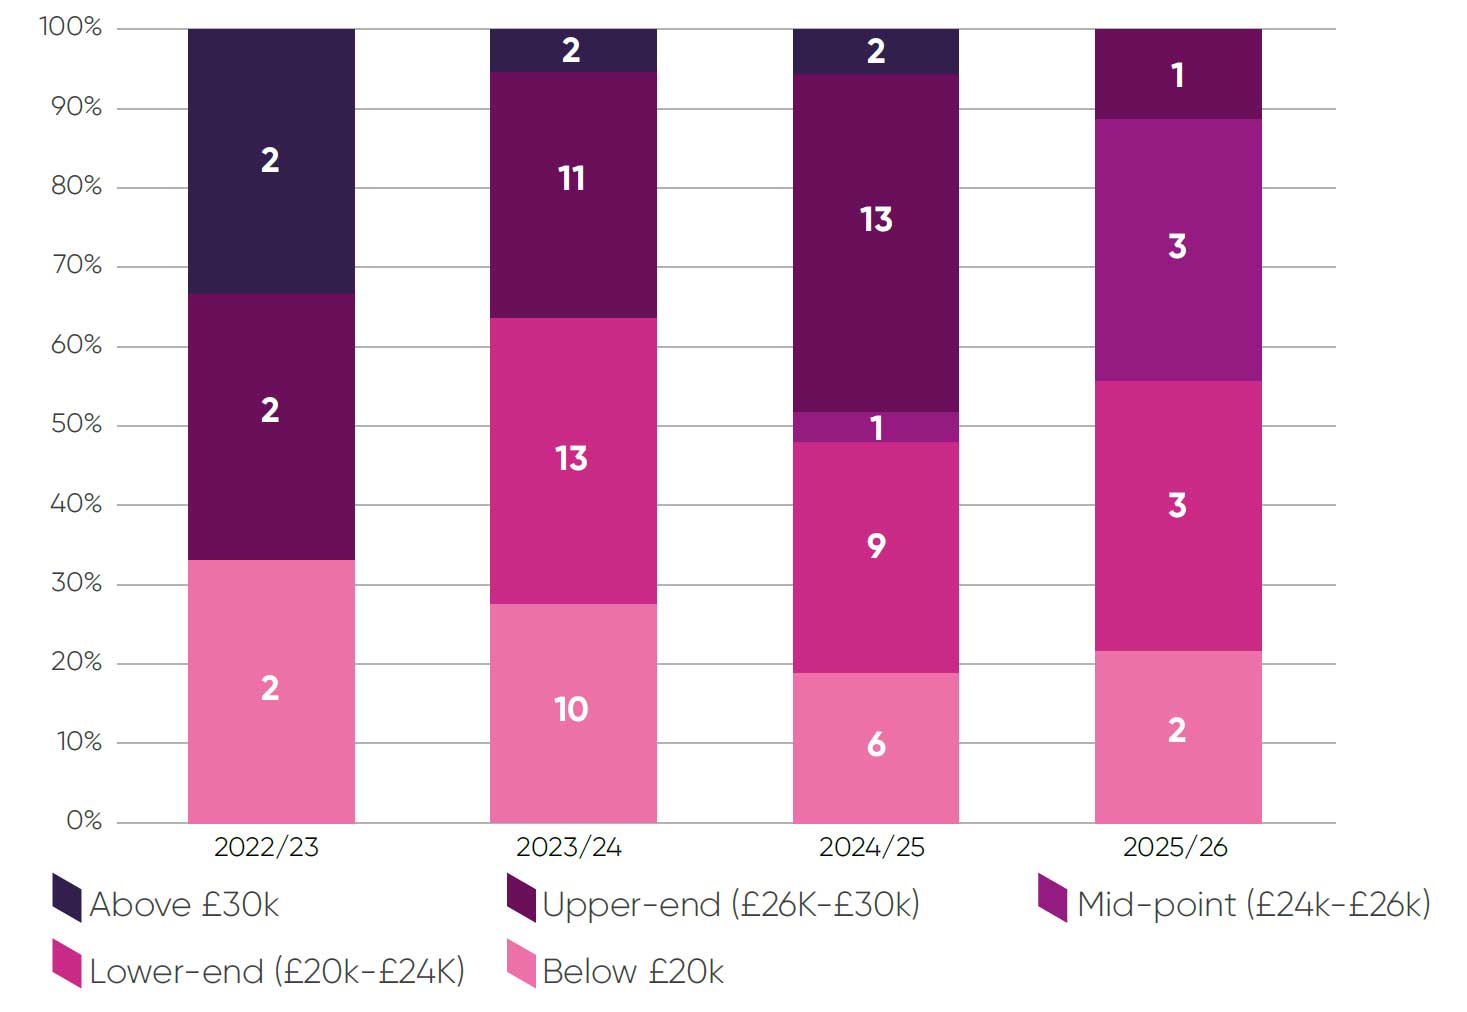
This distribution of decision-making thresholds aligns with research commissioned by the ABPI, which estimated that the weighted average decision-making ICER threshold from 2022-2024 was £24,427.7 This is a marked decrease from a weighted average of £27,065 in 2010-2015.
‘Double counting’ of uncertainty
For this analysis, companies were asked about whether double counting of uncertainty applied using the following definition: “where the appraisal committee accounts for uncertainty both by taking risk-averse assumptions on parameter uncertainty and using a decision ICER threshold at the lower end of the £20,000-£30,000 range”. In these instances, we consider the company may be overly penalised for uncertainty in the evidence base.
Of the 35 topics where companies were asked about double counting of uncertainty, companies identified double counting in seven instances (20 per cent of topics). As this was a new question in the current round, we are unable to draw out trends over time or meaningfully explore whether double counting is more prevalent in topics with certain characteristics. This will be explored in more detail in future CONNIE reports.
Committee consistency on uncertainty
Data from CONNIE also suggest there are differences in how committees manage uncertainty, with some differences in clarity of reporting, distribution of decision-making ICERs and risk aversion. It is unlikely that these discrepancies can be fully explained by the types of topics appraised by each individual committee.
Taken together, the evidence on uncertainty suggests that committees may be becoming increasingly risk averse and showing a preference for assigning decision-making thresholds in the lower end of the cost-effectiveness threshold range. The ABPI considers that committees should take a more balanced approach to managing risk associated with uncertainty in the evidence and be utilising the full range of the threshold in their decision-making. Recent government guidance has said: “Regulators must be attuned to the challenges facing businesses and be able to adapt to new industries, the challenges posed by new technologies and avoid disproportionate risk-averse behaviour”.5 More clarity is needed on how the committees factor uncertainty into their decision-making and what other factors have influenced the decision ICER threshold. Refining this approach will help increase transparency and improve consistency between committees where appropriate.
6. Additional flexibilities
Additional considerations for topics where evidence generation is challenging
Committees can accept a higher degree of uncertainty for conditions where evidence generation is difficult. This includes paediatric populations, rare conditions and for innovative and complex technologies. Companies reported 25 topics (22 per cent) where the committee accepted greater uncertainty (Table 7). There is some variance over time in the proportion of topics where companies are unclear if flexibility has been applied, suggesting that a clearer framework for reporting flexibility may be required to ensure companies and patients understand when flexibilities are being applied.
Table 7: Committee use of flexibilities for topics where evidence generation is challenging
However, of 18 topics where a higher degree of uncertainty was accepted and a decision-making ICER threshold was reported (excluding HSTs) eight topics (44 per cent) had a decision-making ICER in the lower end of the costeffectiveness threshold or below £20,000. This adds weight to the concern that committees may not always be using the full range of the cost-effectiveness threshold where appropriate.
Non-reference case flexibilities
Companies made the case for non-reference case flexibilities in 24 topics. These were accepted or partially accepted on five occasions. There have been 10 requests for a non-reference-case discount rate, none of which have been accepted and seven requests to include wider societal benefits, two of which were partially accepted. In both these cases it is not clear which specific wider benefits the company considers have been captured and whether these made a meaningful impact on the committee’s decision-making process.
The remaining three topics where non-reference case flexibilities were partially accepted or accepted include considerations for non-reference case costs, paediatric efficacy data and one topic where the nature of the flexibilities was unclear.
NICE should take forwards the evidence-based case for changing the reference-case discount rate from 3.5 per cent to 1.5 per cent. Making this change as soon as possible is an essential component of improving the UK’s competitiveness to better recognise the value of medicines and ensure NHS patients have timely access to new innovations. NICE should also bring to life the commitments set out in the HTE Manual to offer non-reference case flexibilities.
Health inequalities
In May 2025, NICE published a modular update to the methods manual on health inequalities.3 This guidance clarified the types of quantitative and qualitative evidence that could be provided to demonstrate the impact of a new technology on health inequalities. Where there is expected to be substantial impacts, the approach of distributional cost-effectiveness analysis (DCEA) should be used to provide quantitative evidence. Where this is demonstrated the committee can apply flexibility to the decision-making costeffectiveness threshold. The committee can also accept greater uncertainty in the evidence on health inequalities if structural and social barriers present challenges generating high-quality evidence. Additionally, a support document on evidential requirements for demonstrating health inequalities and the approach to conducting DCEA analysis was published.8
Seven out of 112 topics (6 per cent) had requested additional flexibilities due to health inequalities. Of these topics additional flexibilities were granted once and there were two occasions where companies were unsure if additional flexibility had been granted.
Future CONNIE rounds will continue to collect data on whether additional flexibilities for health inequalities were requested by companies and whether these were granted by committee, as well as data on whether companies included a DCEA in their submission. The current data (which includes submissions prior to publication of the modular update) serves as a useful baseline to assess the impact of this update.
7. Evidence sources
Surrogate endpoints
The use of surrogate endpoints has been consistent across the reporting period with surrogate endpoints being used in just under 30 per cent of topics. There is good acceptance of surrogate endpoints with only one example where a surrogate was not accepted (Table 8).
Table 8: Use and acceptance of surrogate endpoints
In the 21 topics where the surrogate endpoint was used to predict the final endpoint in the economic model, 14 (67 per cent) were supported by a relationship demonstrated using evidence from randomised controlled trials (level 1 evidence). For the three (14 per cent) topics supported by biological plausibility (level 3 evidence), all topics were in early-stage oncology where companies noted that the link between recurrence and survival is this setting is clear and had been previously accepted by NICE on multiple occasions.
NICE is planning a modular update to the manual on surrogate endpoints. The ABPI notes that data from CONNIE support a view that the evidence being submitted by companies to inform economic models is of a high quality and accepted by NICE in the majority of submissions. Therefore, care should be taken that any proposed updates do not place an additional burden on companies and EAGs to generate and critique evidence when there is not substantial evidence that the current guidance is inadequate.

Real-world evidence
The proportion of topics using real-world evidence (RWE) to estimate or
validate treatment effects has remained consistent across appraisals (Table 9).
Table 9: Use and acceptance of real-world evidence
Of the 41 topics where RWE was used, companies reported some degree of acceptance in 23 topics (56 per cent), which is in line with the previous CONNIE report. This continues to reinforce that committees are willing to accept the usage of RWE in line with guidance updates from the methods review.
Carer quality of life
approximately a quarter of topics including carer quality of life evidence in
2024/2025 (Table 10).
Table 10: Use of carer quality-of-life evidence
Of the 20 topics where evidence was submitted, nine (45 per cent) included carer quality of life in the ICER calculation and it was accepted in all but one case, with full acceptance on four occasions and partial acceptance in the remaining four submissions. Conversely, when carer quality-of-life evidence was not presented as part of the ICER calculation, flexibility was only applied by committee once.
Given this disparity, clearer guidance is needed for incorporating carer quality-of-life evidence into economic models and for committees to understand situations where evidential burdens mean that acceptance of qualitative evidence on carer burdens may be appropriate.
8. Company satisfaction metrics
In this round of CONNIE data, feedback on company satisfaction with the EAG, NICE team and appraisal committee was collected (Figure 6).
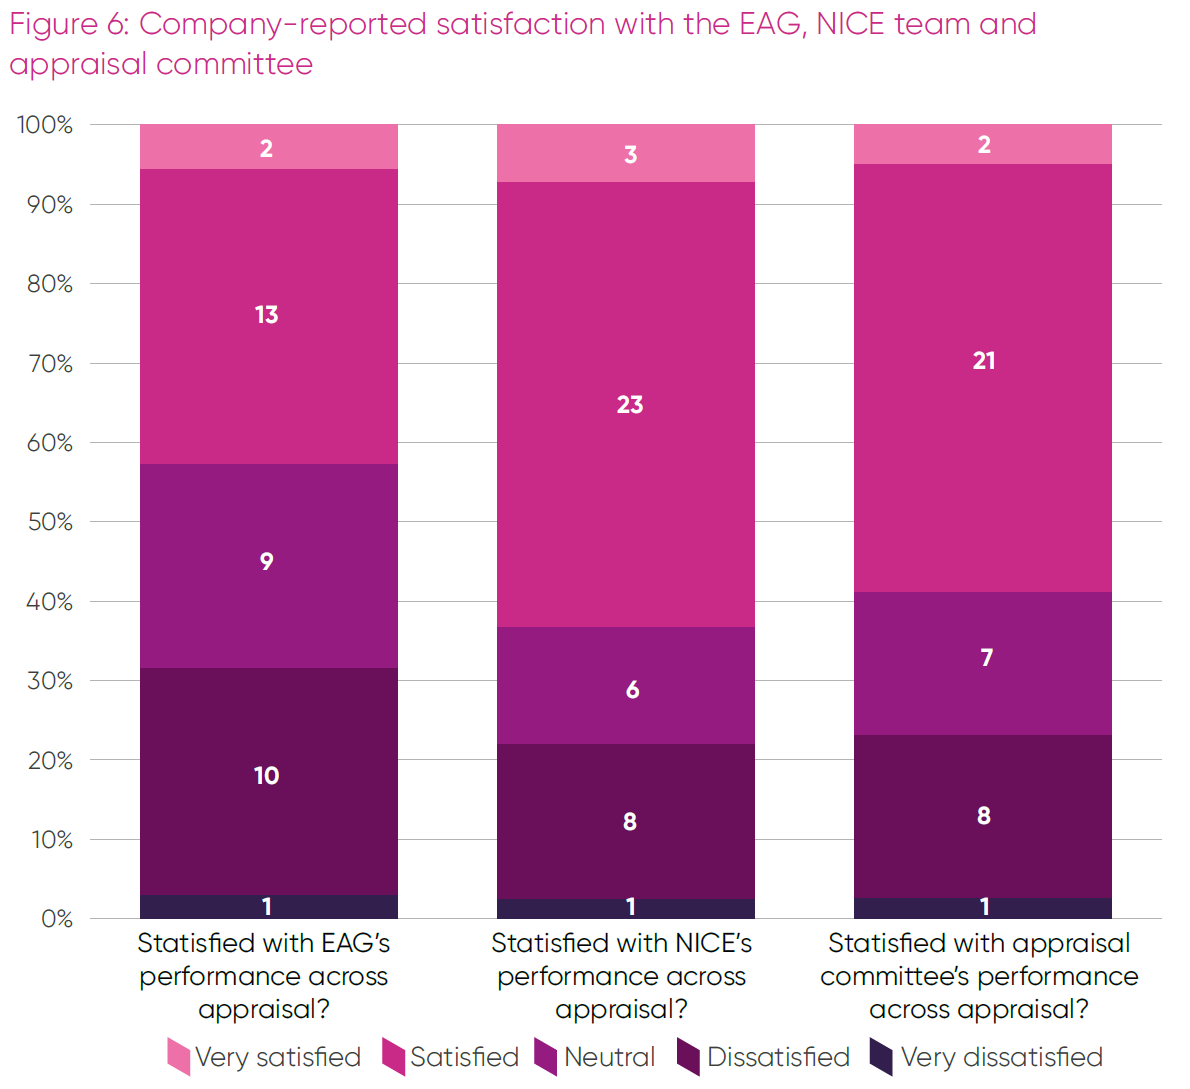
Satisfaction with the NICE appraisal team and the committees was broadly aligned and mostly positive, with feedback on EAG performance more balanced between positive and negative views.
Additional comments explaining these ratings were provided, but the data set is currently too small for a robust thematic analysis of positive and negative experiences. In general, positive feedback highlighted transparency, clarity, pragmatism and timeliness; whereas negative feedback was associated with process delays, lack of clarity, a perception some assumptions were unreasonable and too readily accepted, or a perception of the EAG or committee being allowed to go beyond their remit.

Conclusion
This is the fourth report in the CONNIE series to monitor the implementation of the HTE Manual.
The report details positive company experiences with many aspects of their NICE appraisals, especially in areas such as surrogate endpoints, acceptance of RWE and implementation of the cost-comparison process. However, the data also highlights some areas of concern and where a focus on making changes is needed.
Within the existing methods, these are predominantly around the severity-modifier design, how committees manage uncertainty and its impact on their decision-making, making full use of the threshold range and utilising non-reference case flexibilities where appropriate.
The ABPI is working collaboratively with its members and NICE to support the continuous evolution of NICE’s methods and processes with the aim of improving patient access to new medicines across the UK.
We would like to thank our members for continuing to support us with regular data input into CONNIE, so that we can report insights on the implementation of NICE technology evaluations.

Endnotes
- NICE, ‘NICE health technology evaluations: the manual’, January 2022, accessed September 2025, available at https://www.nice.org.uk/process/pmg36/chapter/introduction-to-health-technology-evaluation
- NICE, ‘Modular updates’, accessed September 2025, available at https://www.nice.org.uk/what-nice-does/our-guidance/modular-updates
- NICE, ‘NICE health technology evaluations: the manual. Update Information’, January 2022, accessed September 2025, available at https://www.nice.org.uk/process/pmg36/chapter/update-information
- To find out more about CONNIE, please contact the ABPI’s Value and Access team.
- ABPI, ‘Reviewing implementation in practice of the NICE Health Technology Evaluation Manual - CONNIE November 2024’, November 2024, available at https://www.abpi.org.uk/publications/reviewing-implementation-in-practice-of-the-nice-health-technology-evaluation-manual-connie-november-2024/
- OHE, ‘Understanding societal preferences for priority by disease severity in England & Wales’, November 2024, available at https://www.ohe.org/publications/understanding-societal-preferences-for-priority-by-disease-severity-in-england-wales/
- Delta Hat, ‘NICE decision-making ICER threshold analysis’, June 2025, available at https://www.abpi.org.uk/publications/nice-decision-making-icer-threshold-analysis/
- NICE, ‘NICE health technology evaluations: the manual. Support document: Health inequalities’, January 2022, accessed September 2025, available at https://www.nice.org.uk/process/pmg36/resources/support-documenthealth-inequalities-15313210669/chapter/evidence-on-health-inequalities
i Decimals denote the weight applied when a topic contains multiple severity modifier decisions across populations. For example, a topic that has one subpopulation with a 1.7 weighting and one subpopulation with a 1.0 weighting will be split into a contribution of 0.5 in the higher QALY weight total and 0.5 in the no QALY weight total.
ii Full data is not available for 2022/23 and 2025/26, therefore a reliable trend cannot be determined from these periods. However data from appraisals published in 2025/2026 so far shows a more balanced approach than in the previous two years.
iii The answer categories were amended in CONNIE Round 4 to include the ‘mid-point’ option. The Round 3 category of £20,000-£25,000 has been grouped with £20,000-£24,000 and the category of £25,001- £30,000 has been grouped with £256,001-£300,000
-
Last modified23 October 2025
-
Last reviewed23 October 2025