
- Executive summary
- Key insights from the analysis
- CONNIE analysis
- NICE guidance outcomes
- Implementation and impact of the increase to the NICE cost-effectiveness threshold
- Process steps and timing
- Severity modifier
- Additional flexibilities
- Evidence sources
- Uncertainty and decision-making
- Company satisfaction metrics
- Conclusion
- Endnotes
- Executive summary
- Key insights from the analysis
- CONNIE analysis
- NICE guidance outcomes
- Implementation and impact of the increase to the NICE cost-effectiveness threshold
- Process steps and timing
- Severity modifier
- Additional flexibilities
- Evidence sources
- Uncertainty and decision-making
- Company satisfaction metrics
- Conclusion
- Endnotes
Executive summary
The ABPI launched the Continuous NICE Implementation Evaluation (CONNIE) project to collect feedback from companies on completion of their appraisals.1 Initially developed to monitor the major methodological changes resulting from the 2022 update to the methods of the National Institute for Health and Care Excellence (NICE), this in-depth feedback has been maintained and expanded, allowing the ABPI to monitor trends in the evidence submitted by companies and how NICE is making its decisions.
This year’s edition of the CONNIE report comes at another time of significant change to the NICE manual for technology appraisal guidance.2 NICE’s cost-effectiveness threshold for technology appraisals (TAs) has changed for the first time in more than two decades, increasing in April 2026 from £20,000–£30,000 per quality-adjusted life year (QALY) to £25,000–£35,000 per QALY.3 Additionally, the change from the EQ-5D-3L to the EQ-5D-5L value set has been implemented.4 Looking forward, research to assess the public’s preferences for treating patients with severe conditions is ongoing and could result in changes to how NICE’s severity modifier is applied.5 In this context, CONNIE remains an important tool to measure the real-world impacts of these changes on patient access to new medicines.
This report is the fifth in the ABPI’s CONNIE series and captures feedback from 183 completed evaluations.
The report details positive company experiences with many aspects of their NICE appraisals. Most notably, early data suggest that the increase in the cost-effectiveness threshold has improved patient access.
However, the data also highlight some areas of concern where a focus on making improvements is needed. In particular, the top end of the cost-effectiveness range still appears to be under-utilised, and non-reference case flexibilities are rarely applied.
A higher threshold will only deliver its full benefit for patients if the whole range is routinely able to be used, and this will be important to monitor as the new threshold range becomes embedded.
Key insights from the analysis
Cost-effectiveness threshold: While the sample size of evaluations published following the cost-effectiveness threshold increase is still relatively small (n = 20), initial results indicate that:
There is a positive impact on access: there was an impact on appraisal outcome (either through achieving a positive recommendation or widening the patient population) in 10 evaluations. For six of these, companies reported that they would not have been able to launch the indication in the UK under the previous cost-effectiveness threshold.
Over 15,400 patients a year could benefit: across all indications where access has been achieved compared with an anticipated decision under the previous cost-effectiveness threshold (either through launch viability or a less restrictive final recommendation), an estimated 15,426 additional NHS patients will be eligible for treatment each year.
Severity modifier: 106 (73 per cent) of single technology appraisals (STAs) in CONNIE received no severity weighting, 28 (19 per cent) the lower x1.2 weighting and 11 (7 per cent) the higher x1.7 weighting.
Of the 90 oncology appraisals there were 17 (19 per cent) where the outcome was either a negative recommendation or a delay of more than a year. None of these qualified for the higher x1.7 weighting.
Instances where there is substantive disagreement over which severity weighting should apply are more frequent in rare conditions, where uncertainty in the evidence base means that it can be more challenging for committees to determine the choice of modifier.
Non-reference case flexibilities: There was only one appraisal where the non-reference case discount rate was granted and only two examples of appraisals where wider societal benefits were partially accepted. Health-related quality-of-life measures other than EQ-5D are infrequently used, with only nine appraisals where alternative measures were accepted or partially accepted.
Evidence sources:
Health inequalities evidence continues to be submitted in around a third of appraisals following NICE’s health inequalities modular update. However, while sample sizes are small, there is a signal that committee acceptance of qualitative evidence is decreasing.
The number of appraisals where carer quality-of-life evidence is submitted by companies is increasing. However, it is rarely accepted when only qualitative evidence is provided.
Committee decision-making and uncertainty:
The proportion of appraisals where the decision-making incremental cost-effectiveness ratio (ICER) was closer to the External Assessment Group (EAG) estimate has fallen from a peak of 69 per cent in 2024/25 to around 40 per cent.
Fewer appraisals over time have a decision-making ICER threshold at the upper end of the range, including when committee flexibilities to reflect challenges in evidence collection are applied.
CONNIE analysis
Note – CONNIE captures company feedback and the analysis presented does not attempt to determine whether modifiers and flexibilities should or should not have been applied in any particular evaluation.
1. Sample
Building on the 112 appraisals outlined in the previous CONNIE report (CONNIE: Round 4),6 this latest report (CONNIE: Round 5) includes an additional 71 appraisals. The total sample now includes data for 183 appraisals that have completed their evaluation (to publication of final guidance), up to August 2026, using the methods set out in the current NICE manual for technology appraisal and highly specialised technologies guidance.
The sample includes 150 (82 per cent) single technology appraisals (STAs), 16 (9 per cent) cost-comparison evaluations, three (2 per cent) multiple technology appraisals (MTAs), eight (4 per cent) Cancer Drugs Fund (CDF)/Innovative Medicines Fund (IMF) exit appraisals, three (2 per cent) highly specialised technology (HST) evaluations and three (2 per cent) other routes. The sample represents 45 per cent of all appraisals using the updated methods (post NICE's methods review) that have concluded in the period August 2022 to August 2026, and 52 per cent when terminated appraisals are excluded.
Date of final guidance publication
Where analysis of trends over time is of interest, this report presents results by financial year, to align with NICE’s reporting periods.
Table 1 outlines the number of appraisals in the CONNIE database by date of final guidance publication and the proportion of appraisals covered by the CONNIE data. Coverage is lower in 2022/23 because data was not collected for the full financial year.
Table 1: Proportion of NICE appraisals in CONNIE database
2022/23 appraisals (%) | 2023/24 appraisals (%) | 2024/25 appraisals (%) | 2025/26 appraisals (%) | 2026/27 appraisals (%) | Total | |
|---|---|---|---|---|---|---|
Appraisals collected in CONNIE | 10 (13%) | 45 (48%) | 50 (54%) | 53 (54%) | 25 (53%) | 183 (45%) |
Appraisals collected in CONNIE (excluding terminated appraisals) | 10 (17%) | 45 (58%) | 46 (61%) | 44 (60%) | 22 (59%) | 167 (52%) |
Sample characteristics
Seventy (38 per cent) new active substances and 113 (62 per cent) licence extensions.
123 (67 per cent) monotherapies, 42 (23 per cent) combination therapies with generics and 18 (10 per cent) combination therapies with other branded medicine(s).
107 (59 per cent) common indications, 65 (36 per cent) orphan indications and 11 (6 per cent) ultra-orphan indications.
Five (3 per cent) advanced therapy medicinal products.
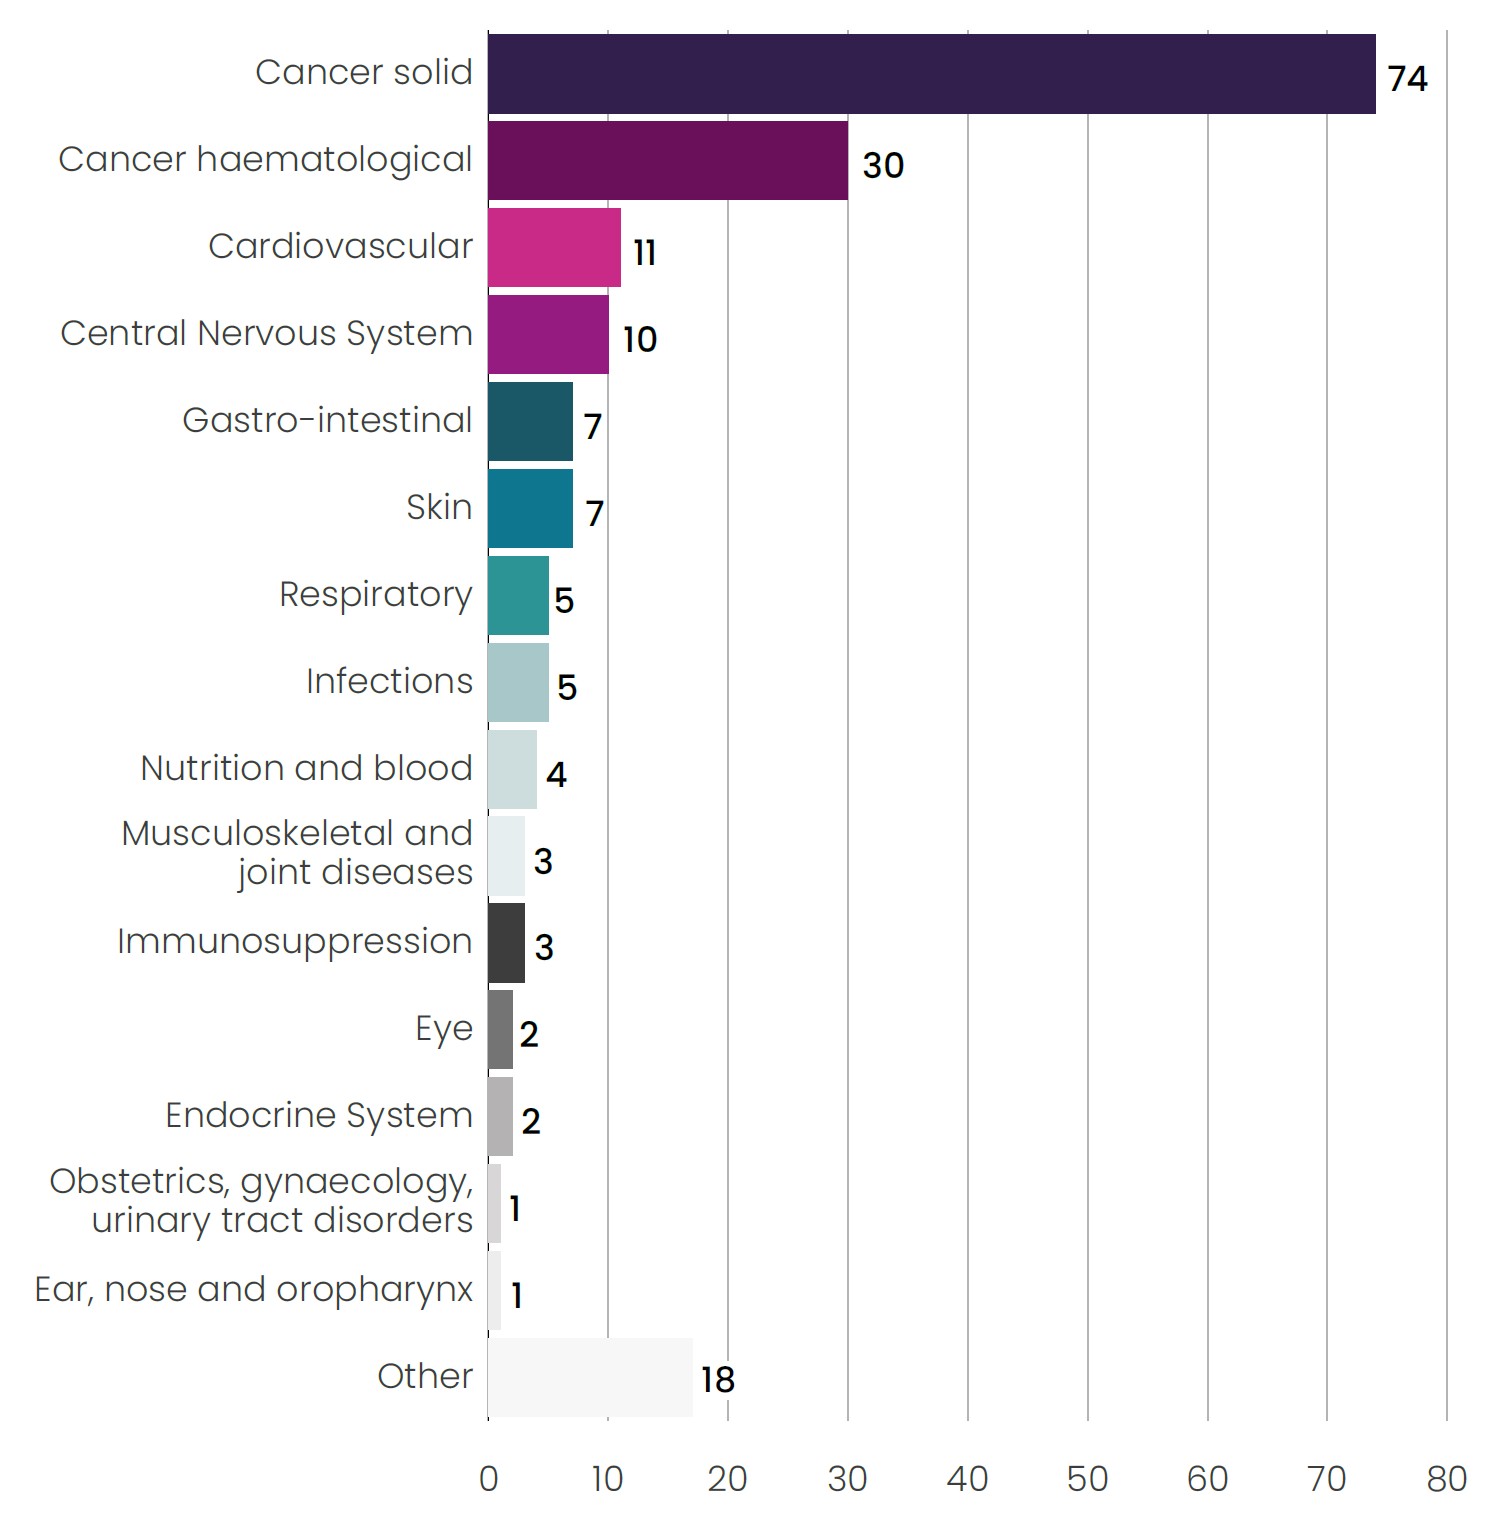
104 (57 per cent) cancer medicines (see Figure 1).
118 (65 per cent) first in class, 36 (20 per cent) second in class, 13 (7 per cent) third in class, two (1 per cent) fourth in class and 14 (8 per cent) other/unknown position in class.
The appraisals covered a representative range of all five NICE appraisal committees.
Figure 1: Breakdown of appraisals by therapy area
2. NICE guidance outcomes
Of the 183 appraisals, 113 (62 per cent) were fully recommended, 32 (17 per cent) were optimised, eight (4 per cent) were recommended for use in the CDF/IMF, 14 (8 per cent) were not recommended and 16 (9 per cent) were terminated (Table 2).
Table 2: NICE guidance outcomes for CONNIE appraisals
Category | 2022/23 | 2023/24 | 2024/25 | 2025/26 | 2026/27 | Total |
|---|---|---|---|---|---|---|
Recommended (full) | 8 | 29 | 34 | 26 | 16 | 113 |
Optimised | 1 | 8 | 5 | 13 | 5 | 32 |
Managed access: CDF | 1 | 2 | 2 | 1 | 1 | 7 |
Managed access: IMF | – | – | 1 | – | – | 1 |
Not recommended | – | 6 | 4 | 4 | – | 14 |
Terminated | – | – | 4 | 9 | 3 | 16 |
Total | 10 | 45 | 50 | 53 | 25 | 183 |
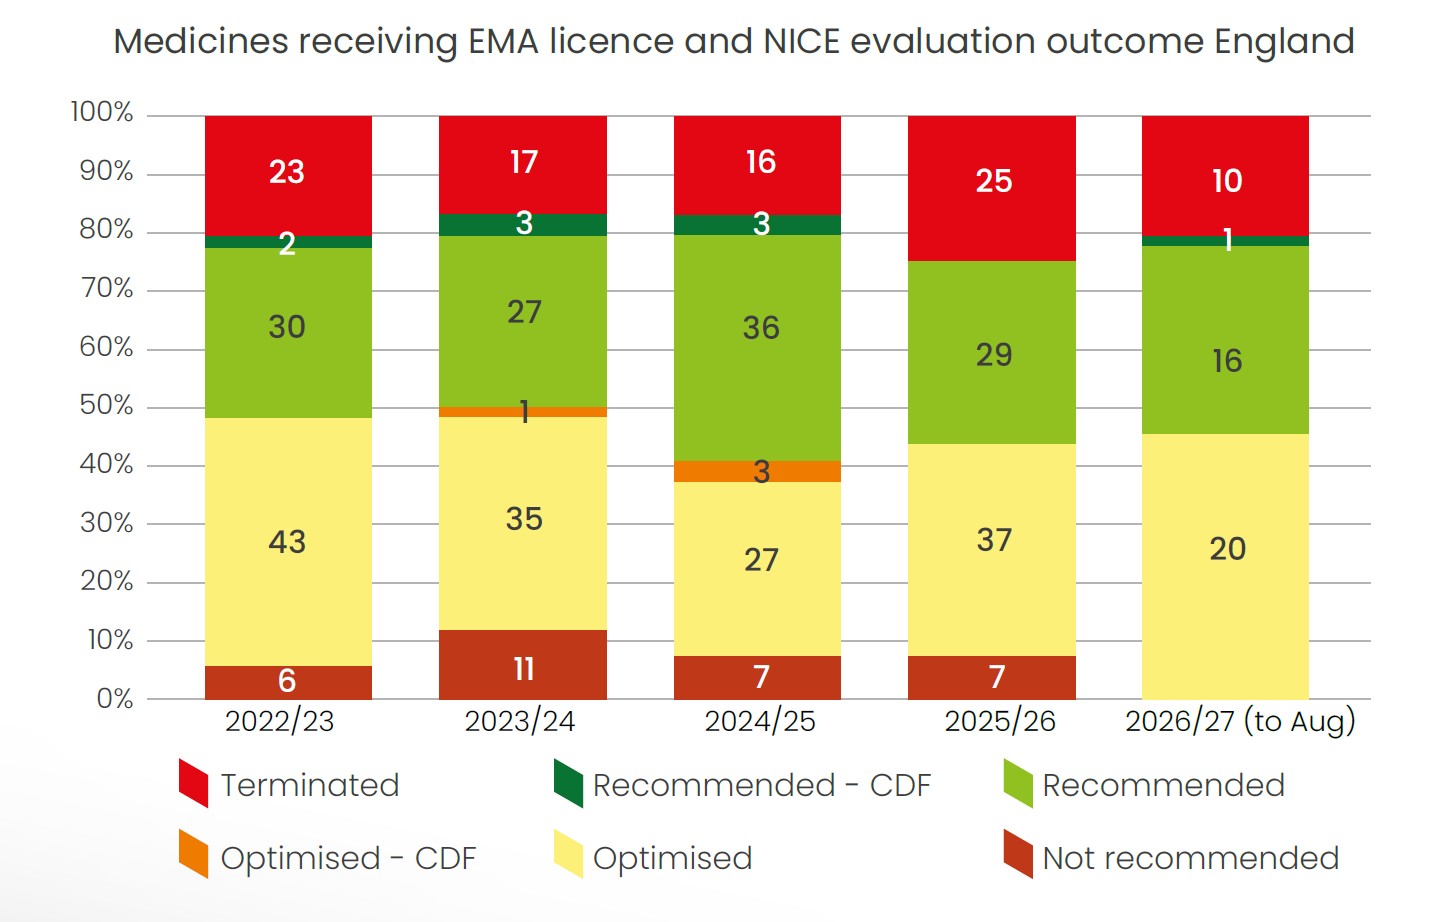
To validate the CONNIE dataset, a comparison of TA outcomes was conducted against outcomes of all NICE appraisals in a comparable time period (Figure 2). The CONNIE dataset is largely representative of a typical NICE sample with respect to outcomes, with two exceptions. The CONNIE dataset outcomes reflect a higher proportion of fully recommended appraisals and a lower proportion of optimised appraisals – this is likely because companies are reporting some optimised appraisals as recommended in CONNIE feedback. Collection of data on terminated appraisals began in 2024/25, with the proportion of terminated appraisals underrepresented in comparison to the outcomes of all NICE appraisals, where the termination rate is consistently around one fifth of all appraisals.
Figure 2: Guidance outcomes in all NICE appraisals (TA and HST) August 2022 to August 2026
3. Implementation and impact of the increase to the NICE cost-effectiveness threshold
The NICE cost-effectiveness threshold increased from £20,000–£30,000 per QALY gained to £25,000–£35,000 per QALY gained in April 2026. To better understand the impact of the threshold increase on patient access, the CONNIE questionnaire explores whether the increase in the cost-effectiveness threshold enabled companies to launch medicines that may not have been launched under the previous threshold and whether the increase in the threshold had other impacts on patient access. These impacts include enabling a NICE committee to make a positive recommendation or enabling a recommendation to extend to a wider patient population than may have been possible under the previous threshold.
Twenty submissions to CONNIE had a guidance publication date after the increase in the cost-effectiveness threshold. Of these appraisals, companies indicated that six (30 per cent) would not have launched at the previous threshold and a further six (30 per cent) were unsure.
In 10 (50 per cent) of the appraisals, the company indicated that the threshold increase had a positive impact on patient access. In one example, this was due to expansion of access to a wider patient population. For the remaining nine, companies considered that the committee may not have made a positive recommendation under the previous cost-effectiveness threshold. While the figure of 10 indications impacted will not capture all indications where there has been a positive impact, it is broadly aligned with figures published by the government in July 2026, which indicated that at that time nine additional medicines had been approved in England and Wales because of changes to the cost-effectiveness threshold.7
Figure 3: Impact of the cost-effectiveness threshold increase on patient access
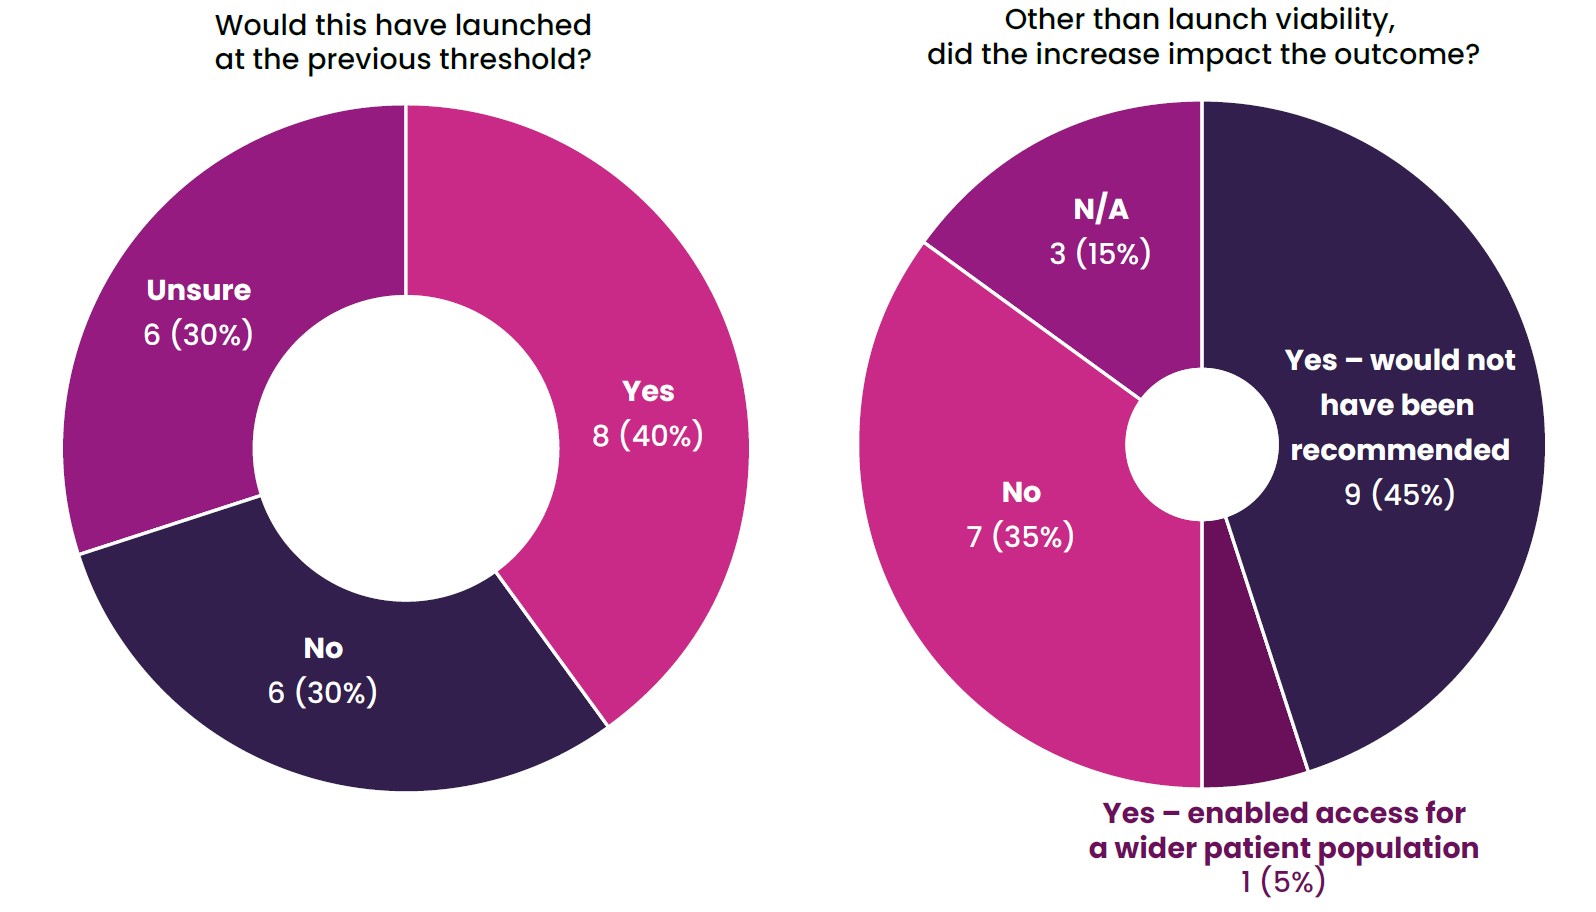
Seven of the positively impacted appraisals were cancer medicines, with two cardiovascular medicines and one medicine for an endocrine condition also benefiting. Based on company estimates of eligible patients, an additional 15,426 patients per year could benefit from access to innovative medicines.
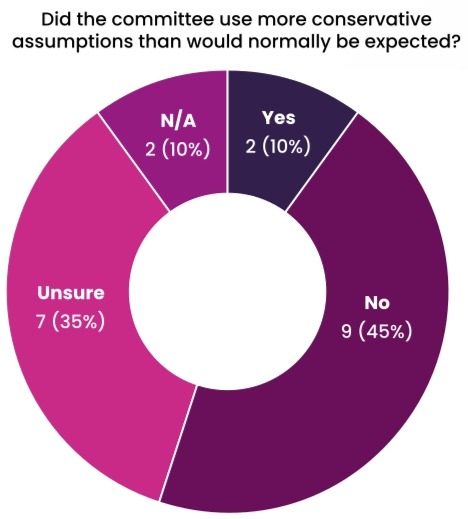
Initial evidence suggests that the committee decision-making approach to managing assumptions has not changed following the threshold increase, with more conservative committee assumptions than would normally be expected being reported in only two (10 per cent) of the appraisals. Responses to this question may have been affected by NICE’s approach to implementing the new cost-effectiveness threshold, whereby the committee’s maximum acceptable ICER was increased by £5,000 for appraisals that had a final committee meeting, but where final guidance had not yet been published.8 Several appraisals were paused to allow for this implementation approach for appraisals in progress between the government commitment being made and the threshold changing. Therefore, it will be important to continue to monitor committee decision-making approaches for managing assumptions and whether there are any changes to risk appetite following the threshold increase.
Figure 4: Company-reported perception of committee decision-making process after the threshold increase
4. Process steps and timing
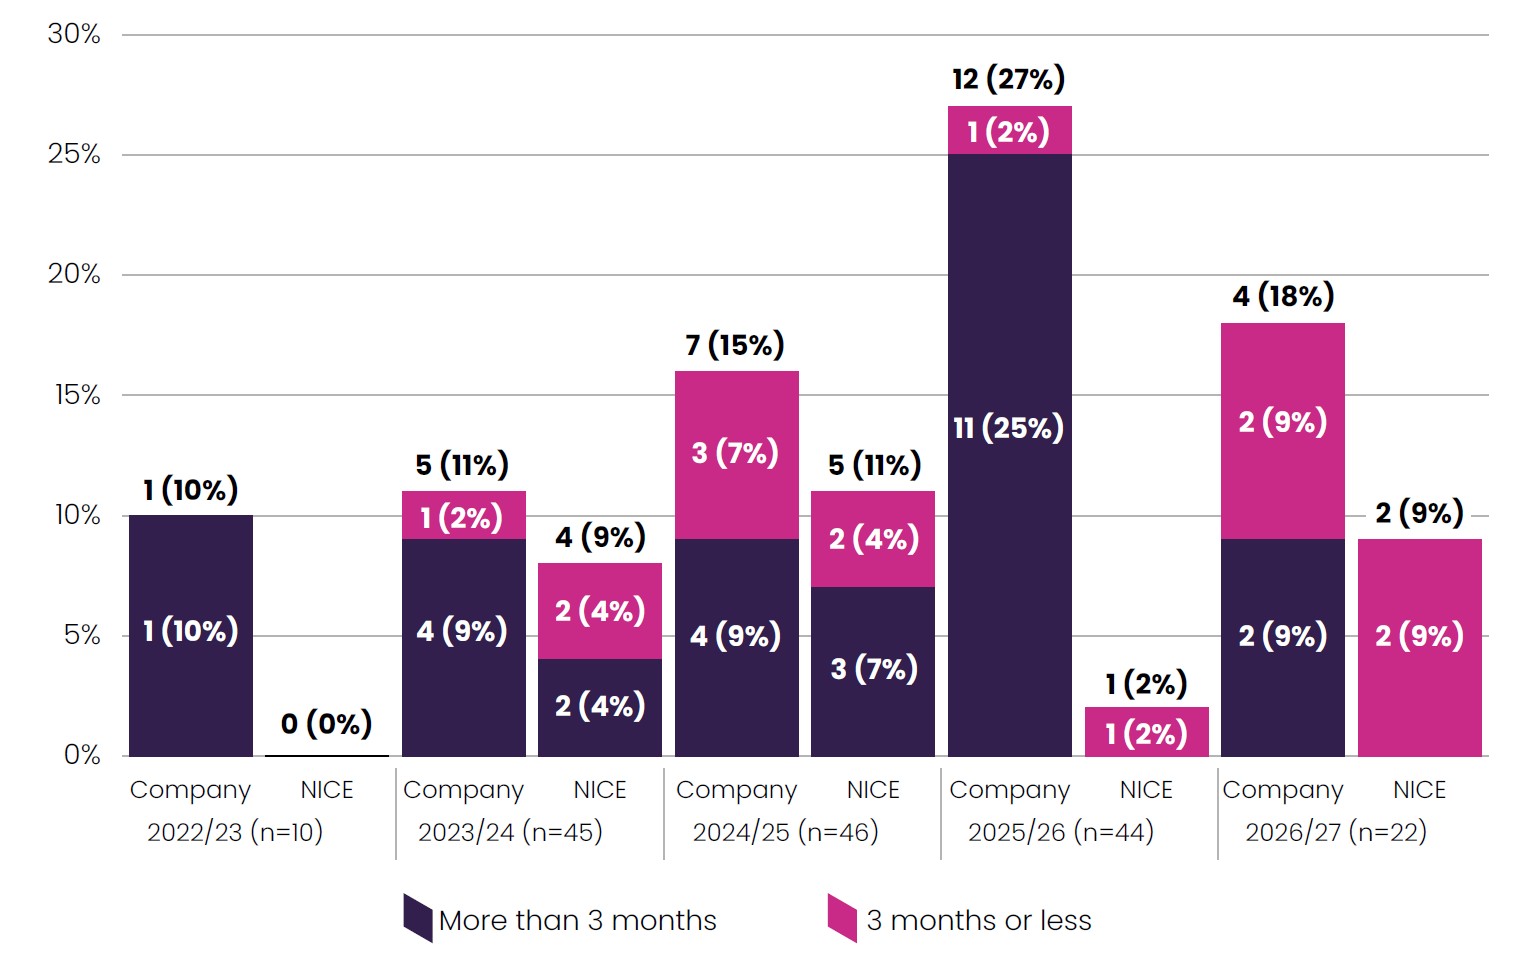
Evaluation scheduling (reported as companies receiving an invitation to participate) was on time for 124 appraisals (74 per cent). Twelve appraisals (7 per cent) had a delay attributed to NICE and 29 (17 per cent) a delay attributable to the company. Scheduling delays initiated by the company have increased in the past 18 months, which could be attributable to challenges UK companies are experiencing in light of significant global pricing policy changes.
Figure 5: Delays reported during scheduling (invitation to participate)
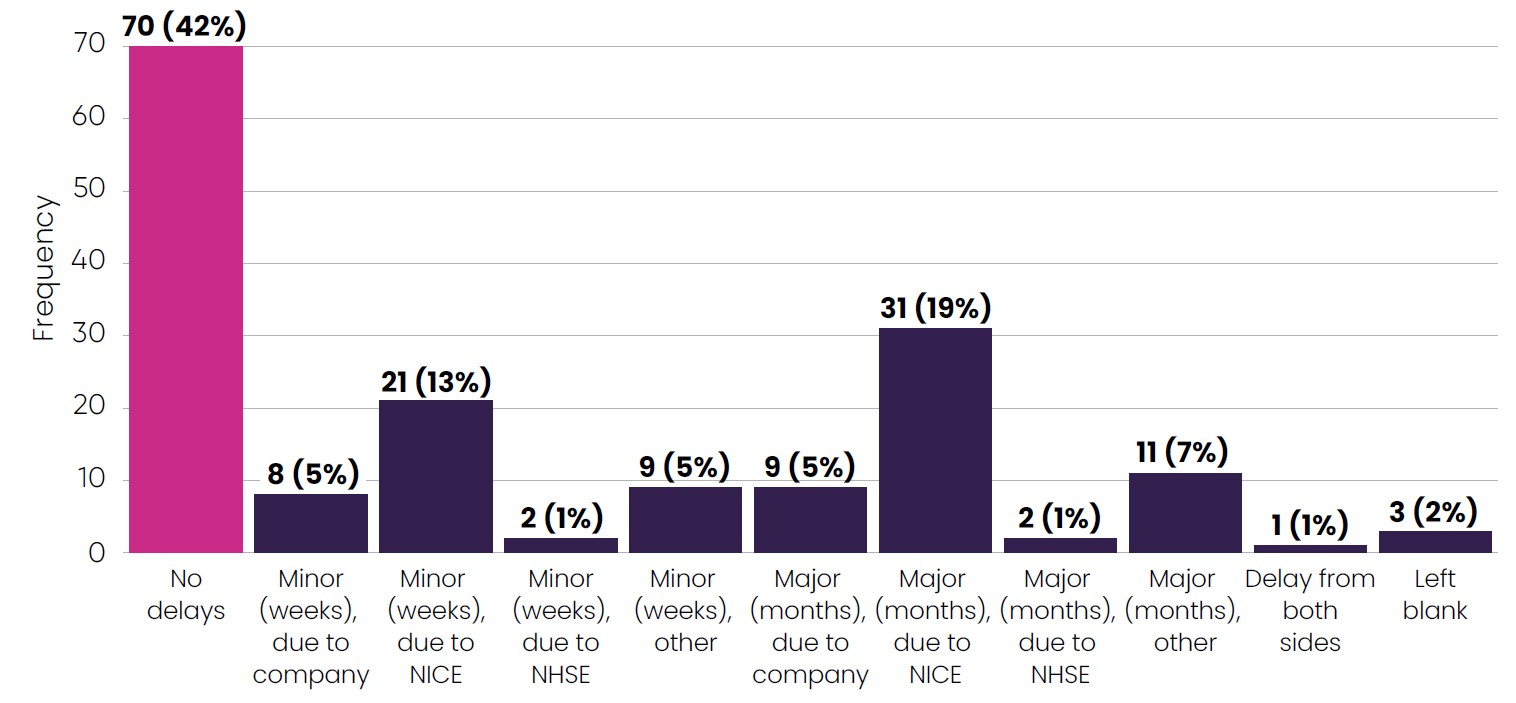
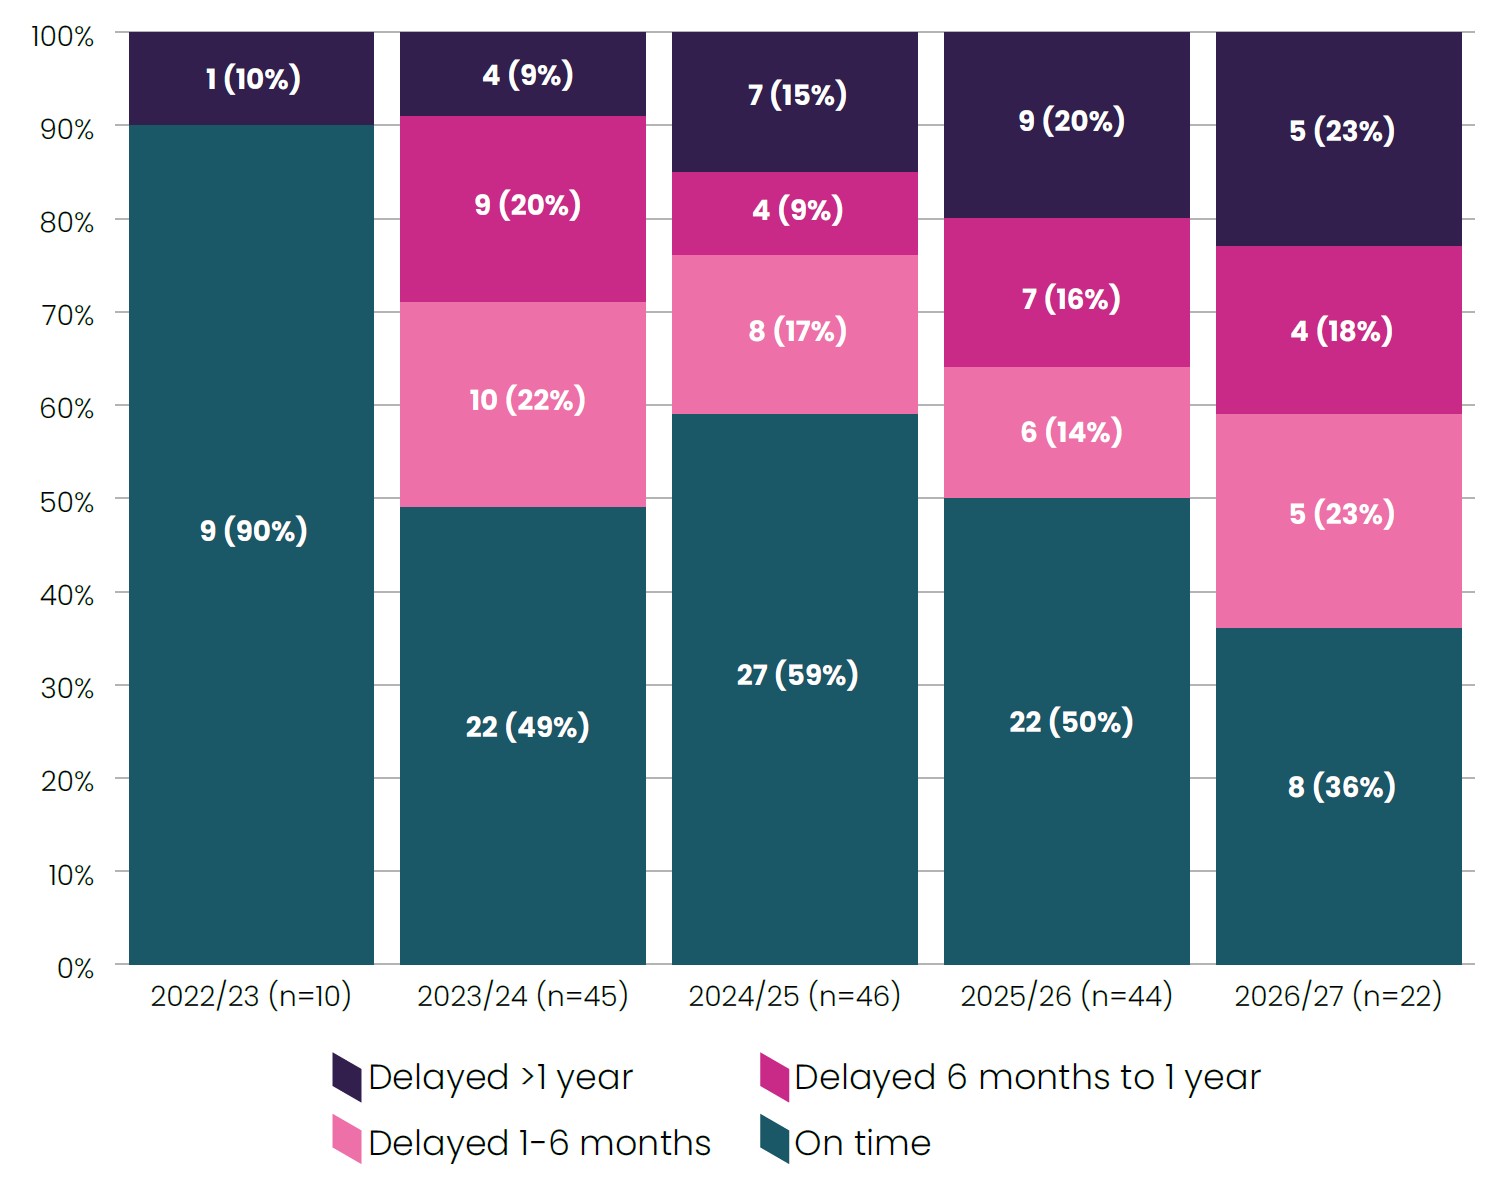
Delays were reported during the evaluation process for 94 appraisals (57 per cent); these were predominantly due to NICE (52 appraisals, 31 per cent; see Figure 6A). The most cited reasons for delays were ‘operational’ reasons alongside requests for additional evidence from the committee or EAG, which on some occasions led to additional committee meetings being required. There were also delays to publication of final guidance in 79 appraisals (47 per cent). While the proportion of appraisals with delays varies over time (see Figure 6B), there has been a steady increase in the proportion of appraisals with delays of longer than a year, which now stands at around a fifth of appraisals.
Figure 6: Delays reported during the evaluation (A) and to final guidance publication (B)
A
B
Appraisal committee meetings
Evaluations proceeding through the cost-comparison process do not always require a full committee meeting, with decisions on approval made by a subset of the NICE committee outside of a formal meeting. All cost-comparison evaluations in the CONNIE database were completed in one or fewer committee meetings.
For appraisals where the cost-comparison process was not used, the average number of committee meetings per appraisal was 1.73 (see Table 3), with an increasing number of committee meetings observed in more recent time periods (an increase from 1.57 meetings in 2022/23 to 2.05 meetings in 2026/27 to date). Where evaluations have proceeded beyond two committee meetings, companies have reported concerns about new or out-of-scope uncertainties or comparators being introduced by the EAG late in the appraisal process or additional evidence being requested by the committee that the company considered to lack a clear basis or justification.
Table 3: Number of appraisal committee meetings needed to conclude each appraisal
2022/23 appraisals (%) | 2023/24 appraisals (%) | 2024/25 appraisals (%) | 2025/26 appraisals (%) | 2026/27 appraisals (%) | Total | |
|---|---|---|---|---|---|---|
1 meeting (or fewer) | 5 | 22 | 23 | 14 | 5 | 69 |
2 meetings | 2 | 19 | 19 | 26 | 13 | 79 |
3 meetings | 1 | 2 | 3 | 4 | 4 | 14 |
4 meetings | - | - | 1 | - | - | 1 |
Left blank | 2 | 2 | - | - | - | 4 |
Total | 10 | 45 | 46 | 44 | 22 | 167 |
Average committee meetings, excluding cost comparison (n = 151) | 1.57 | 1.56 | 1.68 | 1.83 | 2.05 | 1.73 |
Average committee meetings, including cost comparison | 1.50 | 1.53 | 1.61 | 1.77 | 1.95 | 1.67 |
Note – Previous CONNIE reports included data on the technical engagement step. As this is now a step that is only used in exceptional circumstances, it is no longer routinely captured in CONNIE.
5. Severity modifier
The severity modifier is a critical element of NICE’s methods that can determine whether medicines will be recommended for use in the NHS. In 2022 NICE implemented the severity modifier in an ‘opportunity-cost-neutral’ way, designed so that it would assign a similar amount of value to that applied under the old end-of-life modifier, until more evidence is available to inform NICE’s approach.
Table 4 shows the proportion of appraisals that received each weighting in the CONNIE data for company-reported utilisation of the severity modifier. All analyses related to the severity modifier exclude terminated, cost-comparison and HST evaluations - the analysis set includes 144 appraisals.
Across the sample, 10.7 appraisals (7 per cent) received the higher QALY weighting (x1.7), 27.6 appraisals (19 per cent) received the lower QALY weighting (x1.2), and 105.7 appraisals (73 per cent) received no QALY weighting.i
Table 4: Number and percentage of appraisals applicable for severity modifier by financial year (committee-assigned QALY weights)
2022/23 appraisals (%) | 2023/24 appraisals (%) | 2024/25 appraisals (%) | 2025/26 appraisals (%) | 2026/27 appraisals (%) | Total appraisals (%) | |
|---|---|---|---|---|---|---|
Higher QALY weight (x1.7) | 2 (29%) | 1.2 (3%) | 1.5 (4%) | 3 (8%) | 3 (15%) | 10.7 (7%) |
Lower QALY weight (x1.2) | - | 8.1 (21%) | 12.5 (31%) | 4 (11%) | 3 (15%) | 27.6 (19%) |
No QALY weight (x1.0) | 5 (71%) | 29.7 (76%) | 26 (65%) | 31 (82%) | 14 (70%) | 105.7 (73%) |
Total | 7 (100%) | 39 (100%) | 40 (100%) | 38 (100%) | 20 (100%) | 144 (100%) |
i Decimals denote the weight applied when an appraisal contains multiple severity modifier decisions across populations. For example, an appraisal that has one subpopulation with a 1.7 weighting and one subpopulation with a 1.0 weighting will be split into a contribution of 0.5 in the higher QALY weight total and 0.5 in the no QALY weight total.
One approach to reviewing whether the modifier is being implemented as opportunity cost neutral is to look at the average QALY weighting granted per appraisal. A full description of the design of the severity modifier and alternative approaches to this analysis is available in a previous CONNIE report.9 As the data to conduct an analysis using decisions as a denominator are not available in the CONNIE database, we have maintained an approach of using appraisals as the denominator to calculate the QALY weighting, while acknowledging that NICE’s preferred metric is to use the number of decisions. Using appraisals as the denominator, the average QALY weighting in the CONNIE database is 1.090, which is lower than the expected average QALY weighting by its design (1.139) or by NICE's estimated opportunity cost neutrality (1.157).
When considering oncology specifically, of the 90 oncology appraisals in CONNIE, 8.7 appraisals (10 per cent) received the higher x1.7 QALY weighting, 22.6 appraisals (25 per cent) received the lower x1.2 QALY weighting and 58.7 appraisals (65 per cent) received no weighting. There were 17 oncology appraisals (19 per cent) where the outcome was either a negative recommendation or a delay of more than a year. None of these appraisals qualified for a x1.7 QALY weighting and they were more than twice as likely to have qualified for the previous end-of-life modifier (10 of 17 appraisals, 59 per cent) than appraisals that were recommended or delayed for less than a year (19 of 73 appraisals, 26 per cent).
When considering rare conditions, of the 66 appraisals for orphan and ultra-orphan conditions in CONNIE, 7.5 appraisals (11 per cent) received the higher x1.7 QALY weighting, 16.3 appraisals (25 per cent) received the lower x1.2 QALY weighting and 42.2 appraisals (64 per cent) received no weighting. This is broadly in line with results for the full CONNIE sample (Table 5).
Table 5: Summary of severity modifier QALY weightings for oncology and rare-disease appraisals
Higher QALY weight (x1.7), % | Lower QALY weight (x1.2), % | No QALY weight (x1.0), % | |
|---|---|---|---|
Severity-modifier design | 8.2% | 30.5% | 61.3% |
CONNIE, all topics | 7% | 19% | 73% |
CONNIE, oncology | 10% | 25% | 65% |
CONNIE, proportion of oncology appraisals eligible or ineligible for previous end-of-life modifier | 32% | 0% | 68% |
CONNIE, orphan and ultra-orphan | 11% | 25% | 64% |
Company and EAG disagreement over which severity weight should apply was observed in 11 of 66 appraisals (17 per cent) for rare conditions, compared with two of 78 (3 per cent) for common conditions. In two of the rare-condition cases, the company challenged the principle or method of the severity modifier itself; the committee did not accept these arguments in either case. In the remaining nine, the choice of modifier depended on the evidence and modelling assumptions preferred. Committees showed flexibility to account for uncertainty in the evidence base in only two of these nine appraisals (22 per cent).
Recent evidence suggests the current design of the severity modifier is too restrictive and not in line with societal preferences.10 NICE has also commissioned societal preference research for valuing severity to better understand by how much society values treating severe diseases and what constitutes a ‘severe’ condition.5 The outputs of this study alongside other recently reported evidence10 must enable the design of the severity modifier to evolve rapidly and not be constrained by an opportunity-cost-neutral approach.
6. Additional flexibilities
Additional considerations for appraisals where evidence generation is challenging
Committees can accept a higher degree of uncertainty for conditions where evidence generation is difficult. This includes paediatric populations, rare conditions and innovative and complex technologies. Companies reported 38 appraisals (23 per cent) where the committee accepted greater uncertainty in the evidence base (Table 6).
Table 6: Committee use of flexibilities for appraisals where evidence generation is challenging
Did the committee accept greater uncertainty? | 2022/23 appraisals (%) | 2023/24 appraisals (%) | 2024/25 appraisals (%) | 2025/26 appraisals (%) | 2026/27 appraisals (%) | Total |
|---|---|---|---|---|---|---|
Greater acceptance, clear how it affected the decision | - | 6 (15%) | 10 (22%) | 6 (13%) | 2 (9%) | 24 (15%) |
Claimed greater acceptance, unclear how it affected the decision | 1 (13%) | 1 (3%) | 4 (9%) | 3 (6%) | 5 (22%) | 14 (9%) |
Unsure whether greater acceptance flexibility/ acceptance applied | 2 (25%) | 7 (18%) | 16 (36%) | 12 (25%) | 6 (26%) | 43 (26%) |
No flexibility/greater acceptance applied | 4 (50%) | 26 (65%) | 15 (33%) | 27 (56%) | 10 (43%) | 82 (50%) |
Left Blank | 1 (13%) | - | - | - | - | 1 (1%) |
Total | 8 (100%) | 40 (100%) | 45 (100%) | 48 (100%) | 23 (100%) | 164 (100%) |
Where a decision-making ICER is reported, appraisals where flexibility has been granted are more likely to have a decision-making ICER at the upper end of the cost-effectiveness threshold than appraisals where no flexibility is applied. However, consistent with findings in the previous CONNIE report, 43 per cent of appraisals where greater uncertainty is accepted still result in a decision-making ICER at the lower end of the cost-effectiveness range, suggesting that the committee may not be making use of the full range of the cost-effectiveness threshold in applying this decision flexibility (Table 7).
Table 7: Decision-making ICER threshold range by whether the committee accepted greater uncertainty
Did the committee accept greater uncertainty? | Appraisals where decision-making ICER range reported (n) | At or below lower end appraisals (%) | At upper end or above appraisals (%) |
|---|---|---|---|
Greater uncertainty accepted (clear or unclear impact) | 28 | 12 (43%) | 13 (46%) |
No flexibility or greater acceptance of uncertainty applied | 64 | 43 (67%) | 13 (20%) |
Non-reference case flexibilities
Requests to use non-reference case flexibilities are divided into requests related to the suitability of EQ-5D to measure health-related quality of life (HRQoL) and other requests for non-reference case flexibilities outlined in NICE’s methods.
Requests to use alternative measures of quality of life are uncommon, with 13 requests captured in the CONNIE database (Table 8). Of these, nine (69 per cent) were accepted or partially accepted by committees, with vignette studies the least likely to be accepted. Committees were more likely to accept a case that EQ-5D was not suitable in rare conditions (86 per cent of cases) than in common conditions (50 per cent of cases).
Table 8: Acceptance of alternative HRQoL measures
Type of HRQoL measure | Appraisals (n) | Accepted in some form, appraisals (%) | Not accepted, appraisals (%) |
|---|---|---|---|
Disease-specific instrument | 5 | 4 (80%) | 1 (20%) |
Vignette study | 7 | 4 (57%) | 3 (43%) |
Other generic measure | 1 | 1 (100%) | - |
Total | 13 | 9 (69%) | 4 (31%) |
There were 34 other requests made for non-reference case flexibilities, which included the non-reference case discount rate, wider societal impacts (including productivity gains) and requests related to the exclusion of high background care costs. Most of these requests were not accepted, with only one example of a 1.5 per cent discount rate being applied and only two cases where wider societal impacts were partially accepted (Table 9). Requests were also captured where the company used EQ-5D for some or all of the HRQoL evidence in the model but considered that it did not fully capture the impacts on patient quality of life. As these cases are not explicitly captured in the HRQoL section of the CONNIE questionnaire (which explores when alternative measures of HRQoL are submitted), these may be underrepresented.ii
Table 9: Acceptance of non-reference case flexibilitiesii
Type of request | Appraisals (n) | Accepted, appraisals (%) | Partially accepted, appraisals (%) | Not accepted, appraisals (%) | No response or unsure, appraisals (%) |
|---|---|---|---|---|---|
1.5% discount rate | 15 | 1 (7%) | - | 14 (93%) | - |
Wider societal impact | 9 | - | 2 (22%) | 7 (78%) | - |
Excluding high background care costs | 3 | 1 (33%) | 1 (33%) | 1 (33%) | - |
Other non-reference case request | 3 | 2 (67%) | - | - | 1 (33%) |
Other (EQ-5D used but flexibilities requested due to limitations) | 4 | - | - | 4 (100%) | - |
Total | 34 | 4 (12%) | 3 (9%) | 26 (76%) | 1 (3%) |
ii EQ-5D requests were reported as ‘other’ requests and inferred from reference to the appraisal guidance.
The lack of flexibility reported in this section of the report underlines the importance of NICE’s piloting of the inclusion of productivity in its decision-making and the government’s commitment to fund research into wider societal impacts of medicines and vaccines.
Infrequent use and acceptance of non-EQ-5D measures of quality of life underscores why it will be critical to monitor the impact of implementing the new EQ-5D-5L value set and to ensure there are sufficient mitigations in place when it will not allow the full quality of life benefits to be captured. Implementing EQ-5D-5L is likely to mean that interventions that improve quality of life but not length of life generate fewer QALYs. This may exacerbate the challenges of appropriately capturing the quality-of-life improvements in conditions where the EQ-5D does not fully capture HRQoL impacts.
Health inequalities
In May 2025, NICE published a modular update to the methods manual on health inequalities.2 This guidance clarified the types of quantitative and qualitative evidence that could be provided to demonstrate the impact of a new technology on health inequalities. In July 2026, NICE reported data on the monitoring and implementation of this update.11 The NICE report focused on the use of quantitative evidence, such as distributional cost-effectiveness analysis (DCEA), to explore the impact of health inequalities. Two submissions of DCEA evidence were identified; one was accepted by the committee and one was not.
Data from CONNIE on quantitative evidence are aligned with those reported by NICE. Qualitative evidence remains an important consideration, given both the complexity of considerations around health inequalities and potential limitations in the use of DCEA where there is insufficient evidence to conduct a robust DCEA. Submission of qualitative evidence was encouraged as part of the modular update and this appears to have been reflected in company submissions, where qualitative evidence on health inequalities has been submitted in around a third of appraisals following the update.
While the sample size makes it challenging to draw definitive conclusions, there is a signal that acceptance of qualitative health inequalities evidence by committees is decreasing. Appraisals completing in 2025/26 represent a baseline figure, given the lag before the impacts of a methods update are observed. In 2026/27 the proportion of appraisals including company submissions of evidence on health inequalities remains around a third. However, in 2026/27 so far there have been no clear examples of qualitative health inequalities evidence being accepted compared with 31 per cent acceptance in 2025/26 (Table 10).
Table 10. Acceptance of evidence on health inequalities
2022 to 2025 appraisals (%) | 2025/26 appraisals (%) | 2026/27 appraisals (%) | Total (%) | |
|---|---|---|---|---|
Appraisals answering | 34 | 44 | 22 | 100 |
Case made for flexibility: yes | 3 (9%) | 14 (32%) | 7 (32%) | 24 (24%) |
Flexibility granted: yes | 1 (33%) | 4 (29%) | 1 (14%) | 6 (25%) |
Flexibility granted: no | 1 (33%) | 4 (29%) | 4 (57%) | 9 (38%) |
Flexibility granted: unsure | 0 (0%) | 5 (36%) | 2 (29%) | 7 (29%) |
Flexibility granted: N/A / blank | 1 (33%) | 1 (7%) | 0 (0%) | 2 (8%) |
Qualitative evidence: flexibility definitively granted | 1 of 2 (50%) | 4 of 13 (31%) | 0 of 5 (0%) | 5 of 20 (25%) |
The data from CONNIE suggest that the use and acceptance of qualitative evidence should be monitored alongside quantitative evidence. This would help to prevent the unintended consequence of qualitative evidence carrying reduced weight in decision-making due to the existence of a quantitative approach that may be perceived as more robust, but is not always feasible or appropriate. This is particularly important given the potential equalities impacts of the change to the EQ-5D-5L value set.
7. Evidence sources
Carer quality of life
The proportion of appraisals where carer quality of life is submitted is variable, with a generally increasing trend over time (Table 11).
Table 11: Use of carer quality-of-life evidence
Carer quality of life included | 2022/23 appraisals (%) | 2023/24 appraisals (%) | 2024/25 appraisals (%) | 2025/26 appraisals (%) | 2026/27 appraisals (%) | Total appraisals (%) |
|---|---|---|---|---|---|---|
Yes | 1 | 4 | 13 | 7 | 11 | 36 |
No | 9 | 36 | 32 | 37 | 11 | 125 |
Blank | - | 5 | 1 | - | - | 6 |
Total | 10 | 45 | 46 | 44 | 22 | 167 |
Of the 36 appraisals where evidence was submitted, 19 (53 per cent) included carer quality of life in the ICER calculation and it was accepted in all but three cases, with full acceptance on 12 occasions and partial acceptance in the remaining four submissions. Conversely, in the 17 cases when carer quality-of-life evidence was not presented as part of the ICER calculation, flexibility was only applied by committees twice.
NICE has scheduled a modular update to the methods used to evaluate carer quality of life. The ABPI welcomes this opportunity for NICE to provide clearer guidance on alternative measures that may be used if EQ-5D is not suitable and the approach to incorporating carer quality-of-life evidence into economic models. Given the lack of flexibility applied when only qualitative evidence is submitted, there is also an opportunity to provide guidance to committees to understand situations where evidential burden or feasibility challenges mean that acceptance of qualitative evidence on carer burdens may be appropriate. The HRQoL of wider family members should be considered as well as carer quality of life, as the impact on patients’ families can be significant, even if they do not have a formal caring role.
Surrogate endpoints
The use of surrogate endpoints has been consistent across the reporting period, with surrogate endpoints being used in 25 per cent of appraisals. There is good acceptance of surrogate endpoints, with only one example where a surrogate was not accepted (Table 12).
Table 12: Use and acceptance of surrogate endpoints
2022/23 appraisals (%) | 2023/24 appraisals (%) | 2024/25 appraisals (%) | 2025/26 appraisals (%) | 2026/27 appraisals (%) | Total (%) | |
|---|---|---|---|---|---|---|
No surrogate endpoints used | 8 | 33 | 32 | 37 | 13 | 123 |
PFS (for OS): submitted and accepted | 1 | 3 | 2 | - | 3 | 9 |
PFS (for OS): submitted and partially accepted | - | 1 | - | 3 | 2 | 6 |
PFS (for OS): submitted but not accepted | - | 1 | - | - | - | 1 |
Other surrogate endpoint(s): submitted and accepted | 1 | 6 | 9 | 3 | 4 | 23 |
Other surrogate endpoint(s): submitted and partially accepted | - | 1 | 1 | 1 | - | 3 |
Left blank | - | - | 2 | - | - | 2 |
Total | 10 | 45 | 46 | 44 | 22 | 167 |
OS: overall survival, PFS: progression-free survival.
These data continue to support the conclusion in the 2025 CONNIE report that the evidence being submitted by companies to inform economic models is of a high quality and accepted by NICE in most submissions. Therefore, care should be taken that the proposed update to methods used to assess surrogate endpoints in NICE evaluations does not place an additional burden on companies and EAGs to generate and critique evidence when there is no substantial evidence that the current guidance is inadequate.
Real-world evidence
Data on real-world evidence use have been collected and remain consistent with previous CONNIE reports. Real-world evidence was used to estimate, adjust or validate modelled treatment effects in 60 appraisals (36 per cent), with only five appraisals reported where this evidence was explicitly fully rejected. Given that the key focus of CONNIE is to assess the impact of new or upcoming methods changes, we have not reported these data in detail and will be pausing collection of data unless substantive new methods changes in this area are proposed.
8. Uncertainty and decision-making
The previous CONNIE report highlighted a trend towards increasing preferences from committees towards EAG assumptions and for decision-making ICERs to be at the lower end of the cost-effectiveness threshold. Taken together, this was seen as indicative of conservative decision-making by committees. More recent inputs indicate that committees are more evenly split between making decisions more aligned with EAG ICER estimates and company estimates, but there is an increasing requirement for the ICER to be at the mid or lower end of the threshold range. These trends are explored further in the following section.
Decision-making ICERs
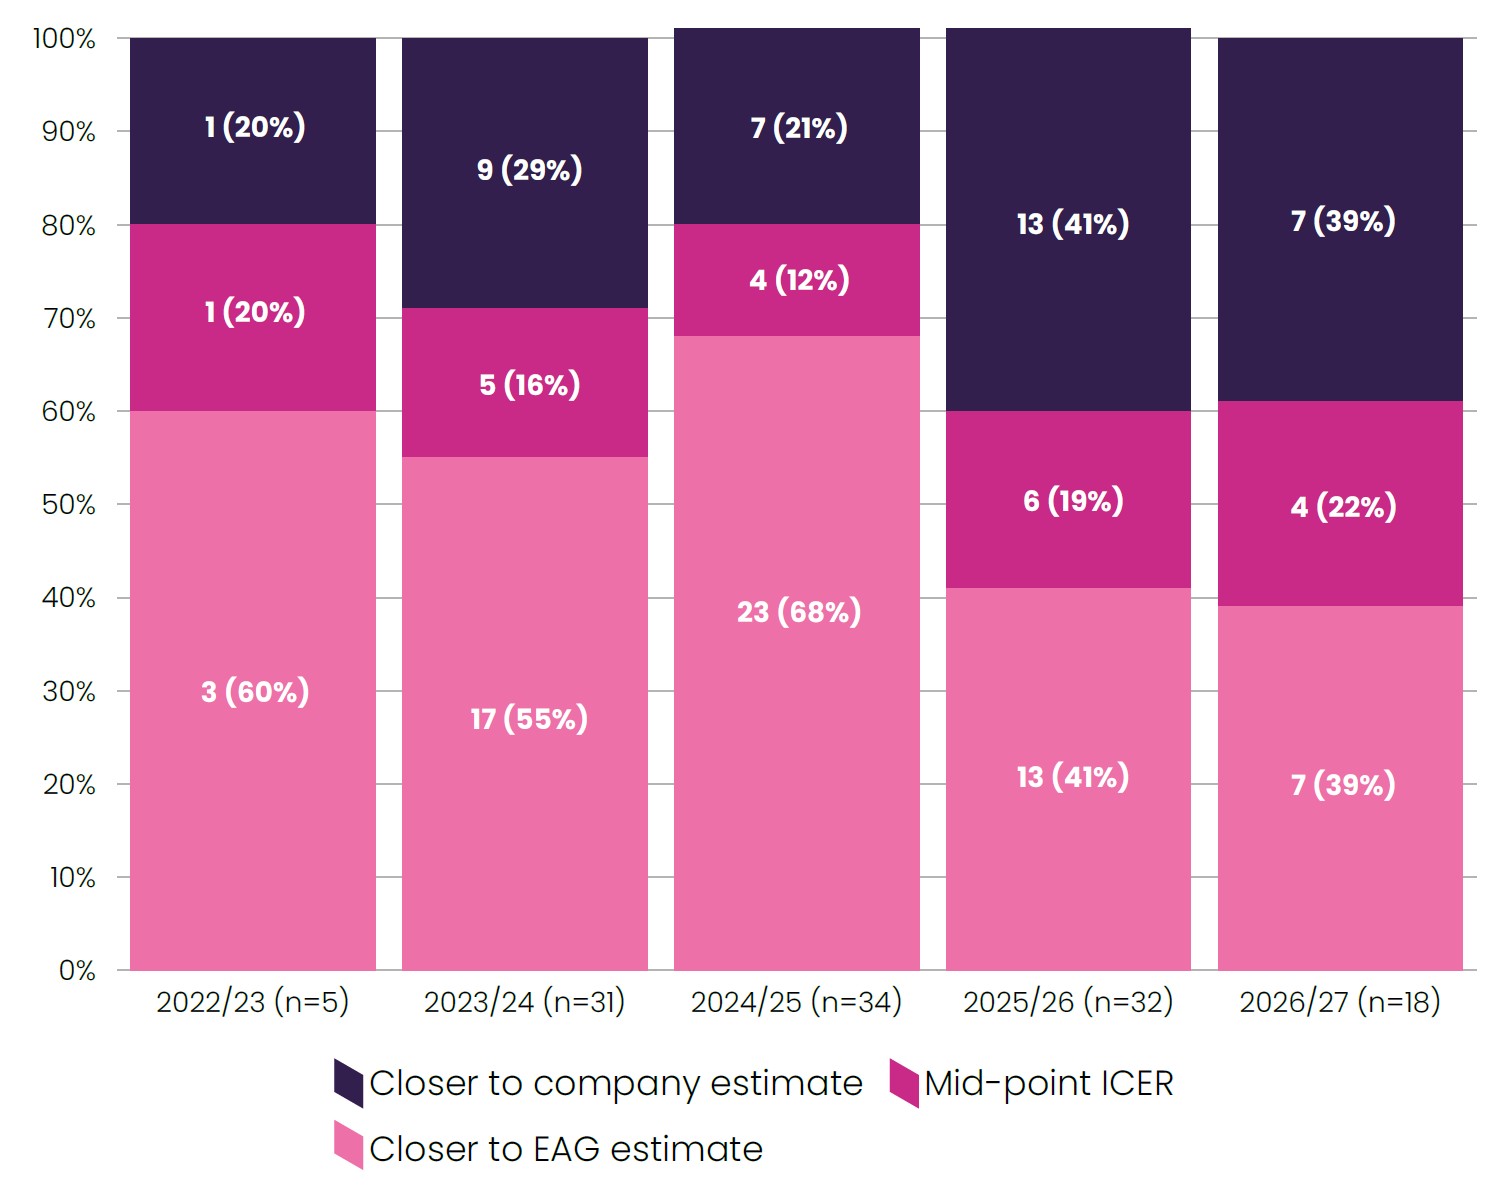
For the 120 appraisals where the decision-making ICER was clear to the company, 63 (53 per cent) were closer to the EAG estimate than the company estimate. From a peak of 69 per cent in 2024/25, this figure has reduced to around 40 per cent in subsequent years, with the final ICER also being closer to the company estimate in around 40 per cent of cases.
Figure 7: Company-reported view on whether decision-making ICER is closer to company or EAG estimate, or at a mid-point of these estimates
On an individual parameter level, of the 61 appraisals where data are available there is still a strong committee preference for acceptance of the EAG-preferred assumptions rather than the company-preferred assumptions (Table 13). A majority preference does not correlate well with whether the decision ICER is closer to the EAG estimate for these appraisals. Potential explanations contributing to this are that the final value of the ICER may depend on a small number of key parameters rather than many parameters with a small impact on the ICER and that the relationship between certain parameters and the ICER is not always linear.
Table 13: Appraisals by majority parameter preference
2024/25 appraisals (%) | 2025/26 appraisals (%) | 2026/27 appraisals (%) | Total (%) | |
|---|---|---|---|---|
Majority preference: EAG | 12 | 17 | 8 | 37 |
Majority preference: company | 2 | 7 | 1 | 10 |
Majority preference: mid-point or equal split | 3 | 8 | 3 | 14 |
Total appraisals with parameter data | 17 | 32 | 12 | 61 |
Number and proportion of appraisals with parameter data where the committee ICER is closer to the EAG estimate | 14 | 10 | 5 | 29 |
Decision-making ICER thresholds
Fifty-nine of 110 STAs (54 per cent) reported decision-making ICER thresholds at the lower end of the cost-effectiveness thresholdiii or below the lower end of the range (Figure 8).
Figure 8: Committee decision-making ICER threshold ranges
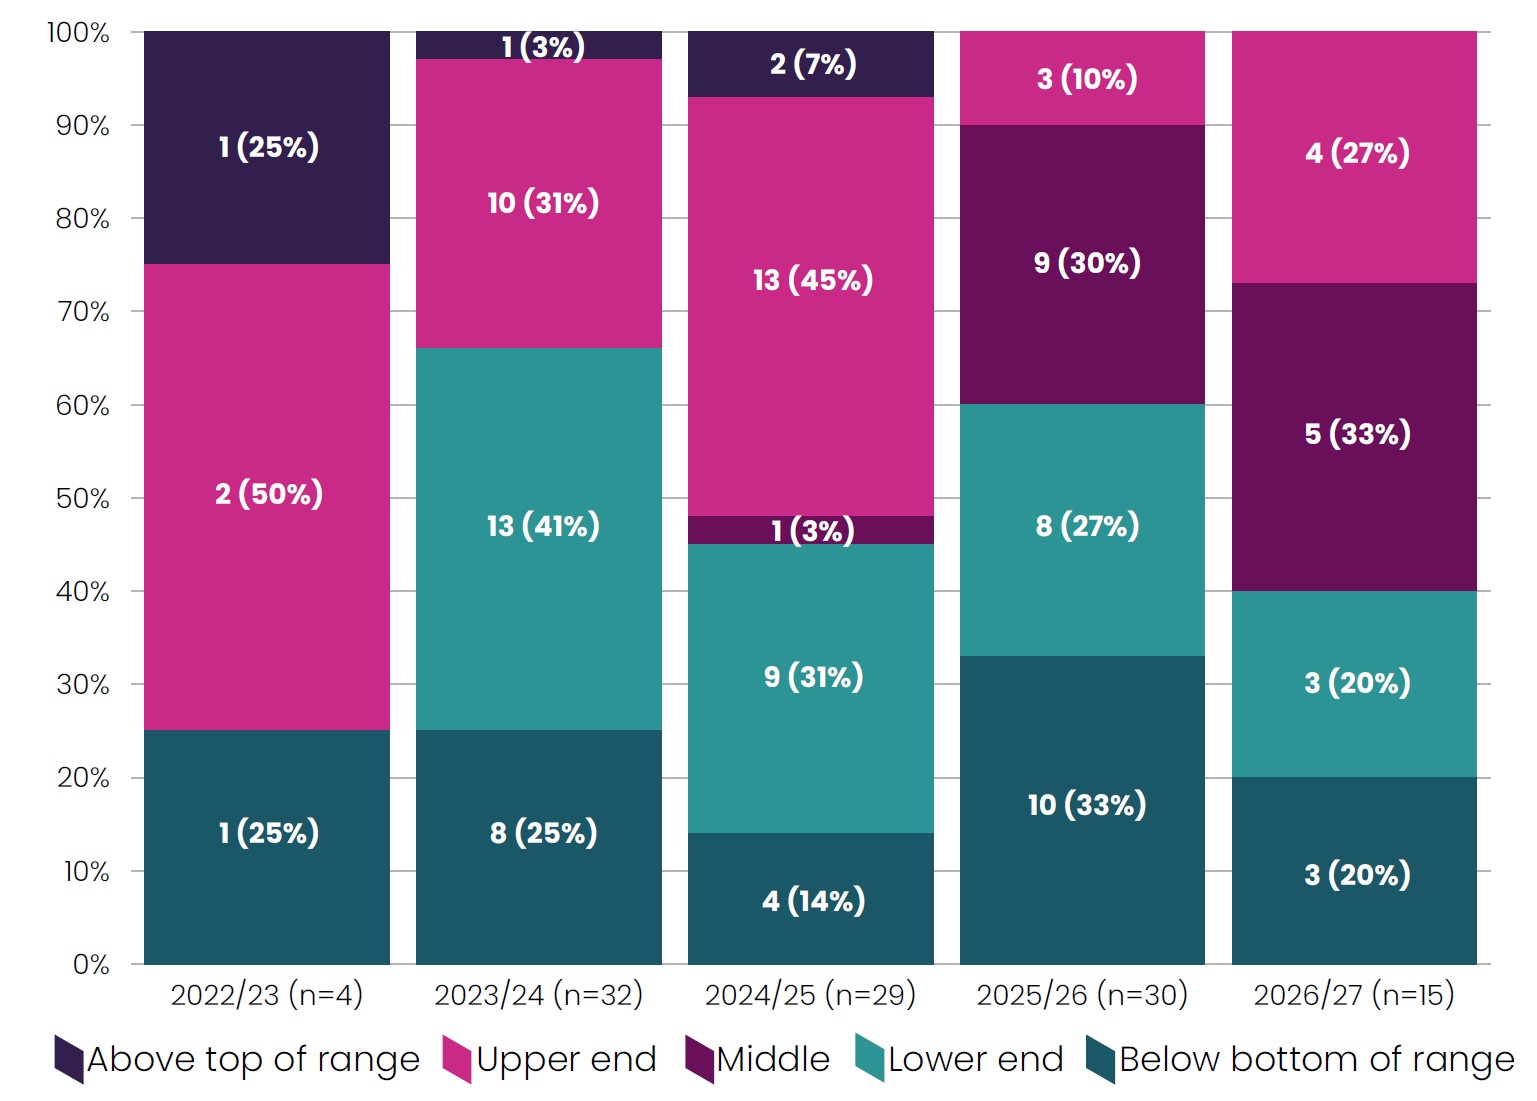
iii The answer categories were amended in CONNIE Round 4 to include the ‘mid-point’ option. The Round 3 category of £20,000-£25,000 has been grouped with ‘lower end’ and the category of £25,001-£30,000 has been grouped with ‘upper end’. In CONNIE Round 5 the values for each threshold range were increased to reflect the increase in the cost-effectiveness threshold.
Over time there has been a decrease in appraisals where the decision-making ICER is at the upper end of the cost-effectiveness threshold or above the threshold range. In 2025/26 there was a marked increase in the proportion of appraisals with a decision-making ICER below the bottom of the cost-effectiveness threshold range. Data in 2026/27 so far suggest that this trend is reversing; however, this should be treated with caution as there may be an artificially increased proportion of decision-making ICERs in the middle of the threshold range due to the £5,000 added to ICERs during the implementation of the cost-effectiveness threshold increase.
‘Double counting’ of uncertainty
The CONNIE questionnaire asks companies about perceived double counting of uncertainty using the following definition: “where the appraisal committee accounts for uncertainty both by taking risk-averse assumptions on parameter uncertainty and using a decision ICER threshold at the lower end of the cost-effectiveness range”. In these instances, the company may be significantly penalised for the uncertainty in the evidence base.
Perceived double counting is reported in a third of appraisals (Table 14). Analysis over time shows that this appears to be a consistent trend.
Table 14: Company-reported double counting of uncertainty
2024/25 appraisals (%) | 2025/26 appraisals (%) | 2026/27 appraisals (%) | Total (%) | |
|---|---|---|---|---|
Yes – double counting perceived | 6 | 11 | 5 | 22 |
No | 10 | 19 | 8 | 37 |
Unsure | 6 | 5 | 4 | 15 |
Total | 22 | 35 | 17 | 74 |
Committee consistency on uncertainty
Data from CONNIE also suggest there are differences in how committees manage uncertainty, with some differences in clarity of reporting, distribution of decision-making ICERs and risk aversion. It is unlikely that these discrepancies can be fully explained by the types of appraisals considered by each individual committee.
How uncertainty is managed in appraisals and the position the committees take on this can have a major influence on whether a medicine can be recommended or not. Committees should: (1) use the full threshold range, allowing for evidential uncertainty and value not sufficiently captured within the ICER to be recognised; (2) take a balanced view of the key assumptions, ensuring these are evidence-based and clinically feasible; and (3) avoid unduly penalising companies when the evidence base is uncertain for legitimate and unresolvable reasons, for example, when patient numbers are very small and/or when medicines are being developed in underserved therapy areas. Continuing to monitor this and ensuring a fair and consistent approach across committees is important.
9. Company satisfaction metrics
Feedback on company satisfaction with the EAG, NICE team and appraisal committee was reported with mixed views (Figure 9).
Figure 9: Company-reported satisfaction with the EAG, NICE team and appraisal committee
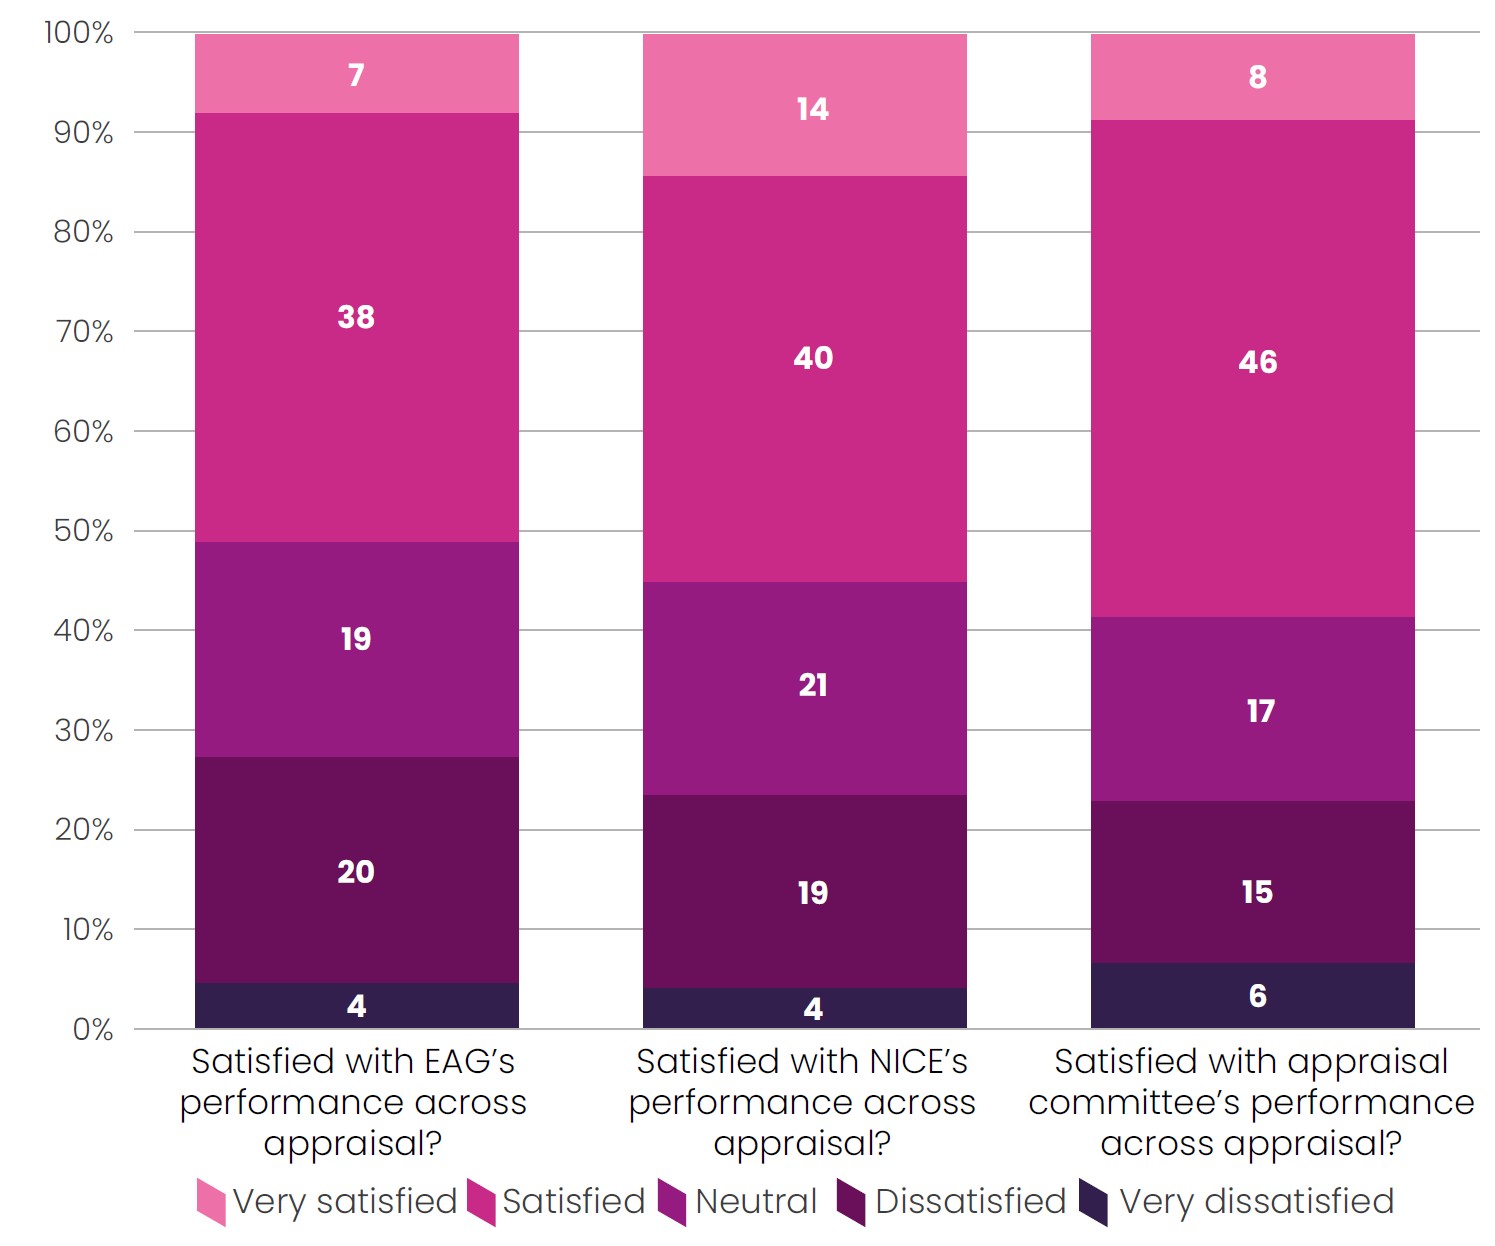
Companies reported broadly similar, and mostly positive or neutral, satisfaction with the EAG, NICE team and appraisal committee.
Companies provided additional comments for around two-thirds of appraisals, reflecting a mix of positive and negative experiences. Feedback was spread across NICE, committees and EAGs, with no single contributor to appraisals attracting a disproportionate share of negative comments. Where feedback was positive, this most often highlighted good communication and responsiveness from NICE teams, clear and well-managed processes and pragmatic, balanced decision-making by committees. Communication stood out as an area closely linked to company satisfaction; positive comments about communication accompanied satisfied ratings in almost all cases, while negative comments about communication were frequent for dissatisfied ratings. Negative feedback more often related to process than to methods or decisions, most commonly delays in the appraisal process and the EAG or committee being perceived to go beyond its remit or the agreed scope. Committee feedback was more likely to be negative when the company reported ‘double counting’ of uncertainty. Other negative comments concerned assumptions that were felt to be insufficiently justified or overly conservative, and the need for repeat meetings or rework. In more recent appraisals, some companies raised concerns that clinical and patient expert input was not given sufficient weight.
Conclusion
This is the fifth report in the CONNIE series to monitor the implementation of NICE methods for evaluating medicines.
The report details positive company experiences with many aspects of their NICE appraisals. Most notably, early data suggest that the increase in the cost-effectiveness threshold has improved patient access. Real-world evidence and evidence based on surrogate endpoints are also routinely accepted. However, the data also highlight some areas of concern where a focus on making improvements is needed. In particular, the top end of the cost-effectiveness range still appears to be under-utilised, and non-reference case flexibilities are rarely applied. A higher threshold will only deliver its full benefit for patients if the whole range is routinely able to be used, and this will be important to monitor as the new threshold range becomes embedded. With further methods changes ahead or recently implemented, including the implementation of the new EQ-5D-5L value set, future editions of the CONNIE report will continue to examine how these changes are implemented and affecting patient access.
The ABPI is working collaboratively with its members and NICE to support the continuous evolution of NICE’s methods and processes with the aim of improving patient access to new medicines across the UK.
We would like to thank our members for continuing to support us with regular data input into CONNIE, so that we can report insights on the implementation of NICE technology evaluations.
Endnotes
To find out more about CONNIE, please contact the ABPI’s Value and Access team.
NICE, ‘NICE technology appraisal and highly specialised technologies guidance: the manual’, accessed October 2026
NICE, ‘Changes to NICE’s cost-effectiveness thresholds’, accessed October 2026
NICE, ‘Interim methods statement: implementing the EQ-5D-5L value set’, August 2026, accessed October 2026
EEPRU, ‘Determining societal preferences for valuing severity within NICE evaluations’, accessed October 2026
ABPI, ‘Reviewing implementation in practice of the NICE Health Technology Evaluation Manual – CONNIE October 2025’, October 2025, accessed October 2026
Department of Health and Social Care, ‘NHS patients get faster access to medicines under new pilots’, July 2026, accessed October 2026
NICE, ‘Statement of intent on NICE’s approach to ongoing evaluations ahead of proposed changes to NICE’s standard cost-effectiveness thresholds’, February 2026, accessed October 2026
ABPI, ‘Reviewing implementation in practice of the NICE Health Technology Evaluation Manual – CONNIE November 2024’, November 2024, accessed October 2026
Hayes H et al., ‘Understanding societal preferences for priority by disease severity in England and Wales’, Value in Health, Volume 29, Issue 6, pp. 1095–104, June 2026
NICE, ‘Monitoring and implementation of the health inequalities modular update’, July 2026
-
ThemeValue
-
KeywordsCONNIE
-
PublisherABPI
-
Last reviewed date19 November 2026
-
Next review date19 November 2031